

Fundamentally Speaking
July Temps for Top Corn & Soybean States

In the wake of the USDA August crop production report released last week it appears that the trade is more willing to embrace the record U.S. soybean yield forecast of 48.9 bushels than the corn projection of 175.1 bpa.
Both forecasts are above the 2014 corn record of 171.0 bpa and last year's all-tine high soybean yield of 48.0 bpa.
There continues to be sentiment that in some areas of the Midwest a combination of too dry conditions and warm temperatures may have adversely impacted the corn pollination process in some states resulting in some reported cases of tip-back, a condition that results in corn kernels not filling all the way toward the end of the year.
P[L1] D[0x0] M[300x250] OOP[F] ADUNIT[] T[]
This could result in lower ear weights though interestingly the USDA is saying that their 10 state objective implied ear weight figure is record high.
In this piece we take a look at July temperatures in the top corn and soybean producing states given the realization that all things being balance corn likes cool as opposed warm July temperatures.
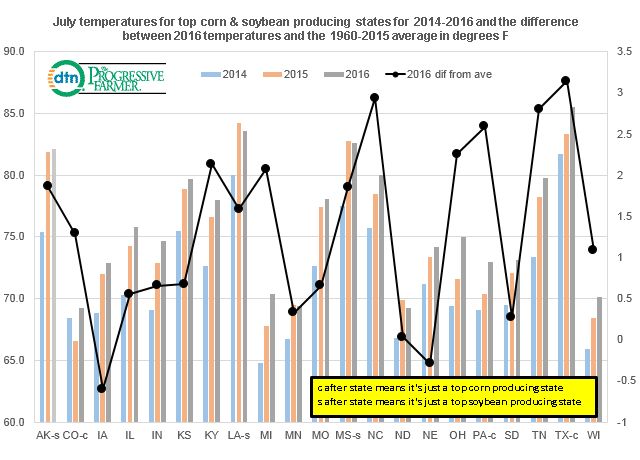
This graphic shows the July temperatures for this year, the record soybean yielding season of a year ago and the record corn yield season for 2014, all plotted on the left hand axis.
The difference between this year's July temperatures and the 1960-2015 average is plotted on the right hand axis, also in degrees Fahrenheit.
First off note that 2015 and especially 2014 saw cool Julys as opposed to this year where all but two northern states MN and ND and two southern states LA and MS had 2016 temperatures above their respective 2014 and 2015 values, with nine states having July 2016 temperatures at least five degrees above their corresponding 2014 readings.
In additional, all but two states IA and NE had their 2016 July temperatures above the 1960-2015 average with KY, MI, NC, OH, PA, TN and TX being at least 2.0 degrees above the average.
Though the July 2012 readings were much hotter it appears that if the final 2016 U.S. corn yield comes in lower than last week's 175.1 bpa projection, a possible answer may be the warmer than normal July 2016 readings in the key producing states.
(KA)
© Copyright 2016 DTN/The Progressive Farmer. All rights reserved.
Comments
To comment, please Log In or Join our Community .