

Fundamentally Speaking
IA & IL Accounting for Smaller % of Row Crop Output
Anecdotal reports suggest that the 2016 corn and soybean crops in Iowa and Illinois crops are stellar, which is no small consideration as for years they have been the top two producing states of both key commodities.
No wonder that current USDA crop ratings of corn and soybeans are at 22 year highs, among the best since 1986 fueling talk that U.S. yields of both will be record high this season with both states accounting for a large portion of total bushel output.
P[L1] D[0x0] M[300x250] OOP[F] ADUNIT[] T[]
The fact is that the increased planted acreage of corn in areas of the Western Corn Belt and Plains, especially in the Dakotas, and more soybeans being seeded in areas of the Delta and Southeast displacing such crops as peanuts and cotton, has resulted in a declining percent of combined Iowa and Illinois row crop production as a percent of national output.
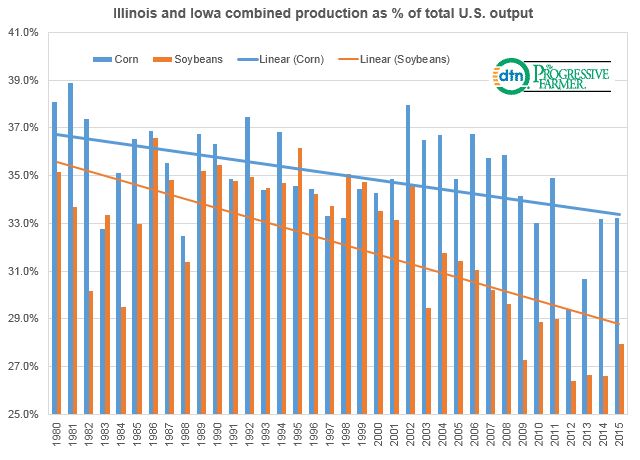
The accompanying graphic shows just this, combined corn and soybean output in what still are the two largest producing states as a percent of U.S. production.
35 years ago Iowa and Illinois accounted for about 39% of the domestic corn crop but that sank to 29.4% in 2012 with the 1980-84 average at 36.4% vs the 2011-15 average of 32.2%.
For soybeans, the decline has been even steeper as denoted by the orange trend line with the 1980-84 average at 32.3% declining to 27.3% in the 2011-15 period.
It will be interesting to see what happens going forward for in areas outside these two states, the economics for planting alternative crops such as spring wheat, sorghum, oats, tobacco and other oilseeds have declined relative to corn and soybean returns but with those two crops seeing their lowest values in close to ten years this may no longer be the case.
(KA)
© Copyright 2016 DTN/The Progressive Farmer. All rights reserved.

Comments
To comment, please Log In or Join our Community .