

Fundamentally Speaking
Stats Can Crop Estimates
The Canadian December crop estimates released this week by the government reporting agency Statistics Canada (Stat Can) proved to be a bearish surprise for most of the markets and helped pressure U.S. values.
Canadian 2013 canola production was hiked by 12.5% from the October figure to 17.960 million tonnes, a new record while all wheat production was revised higher by 13.6% to 37.530 million tonnes, also a new record by far.
Their 2013 corn output was pegged at 14.194 million tonnes, up 8.7%, also a new record.
P[L1] D[0x0] M[300x250] OOP[F] ADUNIT[] T[]
One of our first thoughts was the big increases noted in Canadian grain and oilseed production was our neighbors to the north had great finishing weather this past growing season.
The U.S. also had great finishing weather with better rains the last half of September and a historically late first fall freeze.
This suggests that the USDA may also post sizable increases for 2013 final U.S. corn and soybean output in the January 11 production report from what was reported in November.
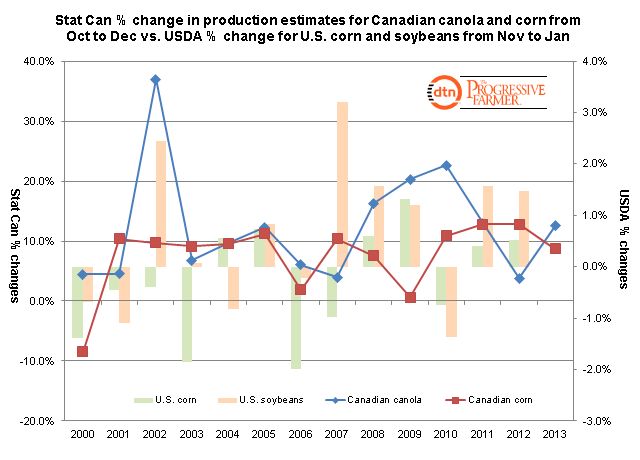
To test this theory, we compared the percent change in Canadian canola and corn production from the October to December crop numbers as reported by Stat Can vs. the USDA revisions for U.S. corn and soybean production from the November to January report.
The data really does not correlate well as Stat Can has increased its canola estimate every year since 2000 from October to December and all but one year for corn.
The percent changes made by Stat Can are also much larger than the ones made by the USDA. Another factor is the Stat Can October figures do not include output from the maritime provinces or British Columba and over the years, combined output has been 2-4% of national output.
The correlation between canola and soybean changes is 24.5% and the correlation between the two corn revisions is 29.2%.
Still, the good finish to the U.S. growing season along with continued stellar yield reports even as the harvest expanded north implies larger final crop sizes for both corn and soybeans.
(KA)
© Copyright 2013 DTN/The Progressive Farmer. All rights reserved.

Comments
To comment, please Log In or Join our Community .