
Fundamentally Speaking
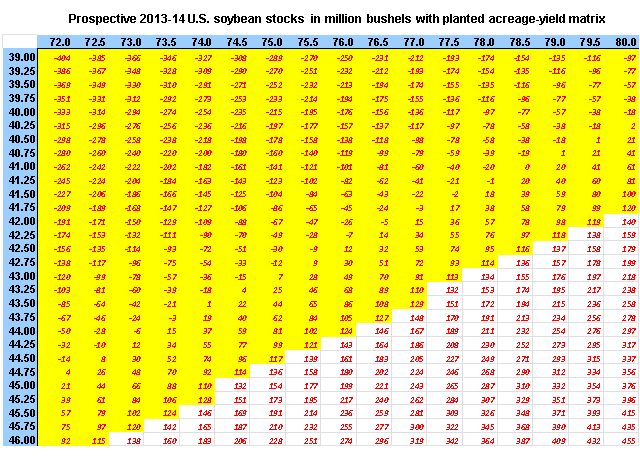
Prospective 2013-14 U.S. Soybean Ending Stocks Matrix

In a prior piece, we presented a matrix of prospective 2013-14 U.S. corn ending stocks based on various combinations of planted acreage and yields.
Here we do the same thing except this time the matrix is of prospective 2013-14 U.S. ending soybean stocks in million bushels.
There are certain assumptions we use including a beginning stocks of 125 million bushels based on the February 2013 WASDE report and estimated 2013-14 demand at 3.295 billion bushels which is what the government projected total usage would be at the recent USDA Agricultural Outlook Conference.
We also use a 98.5% harvested to planted ratio that is slightly lower than the 98.8% ratio given in the USDA 2013-14 soybean balance sheet.
P[L1] D[0x0] M[300x250] OOP[F] ADUNIT[] T[]
As an example, looking at the planted acreage figures going across the x-axis and the yields going down the y-axis has a figure of 124 million bushels at the intersection of 76.0 million acres and 44.0 bushels per acre.
This is arrived at by taking 76.0 million times 98.5% times 44.0 bushels per acre that results in a production figure of 3.294 billion bushels.
To that, we add beginning stocks of 125 million and then subtract the USDA estimated 2013-14 demand of 3.295 billion bushels resulting in a figure of 124 million bushels.
For corn, it is almost assumed that the 2013-14 ending stocks will be significantly higher than the currently estimated 632 million bushels.
This based on the highest planted acreage in about 75 years and a return to normal summer weather that should result in much less abandoned acreage and close to trend yields.
For soybeans, it is already assumed that 2013 planted acreage will be record high and yields will be substantially improved over what was seen in 2012.
The problem is that there is a far greater likelihood that soybean demand will bounce back strongly from this year’s depressed rate of consumption than corn resulting in a still tight stocks and stocks to use ratio.
This is shown in the graphic where all the ending stocks shaded in yellow result in stocks to use ratio less than 4.0% assuming 2013-14 demand is 3.295 billion bushels.
Note how relatively high yields and large acreage will be needed just to maintain a stocks to use ratio of 4.0%, which is what the USDA is projecting for this year.
This is the lowest ratio ever and a level that the USDA is unlikely to go below when issuing future supply-demand tables.
(KA)
© Copyright 2013 DTN/The Progressive Farmer. All rights reserved.
Comments
To comment, please Log In or Join our Community .