
Canada Markets
Licensed Deliveries as a Percent of Estimated Supplies
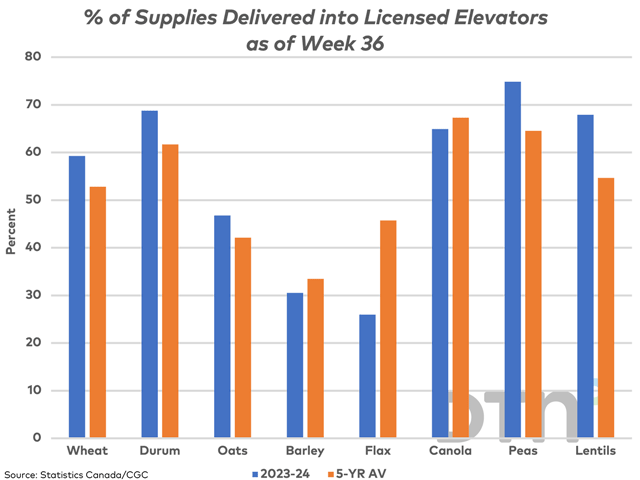
The above chart shows the Canadian Grain Commission's cumulative producer deliveries as of week 36 -- the week ended April 7 or the first 69% of the crop year -- as a percentage of total supplies available for delivery. These supplies are calculated by adding beginning farm stocks for the crop year (or the July 31 ending stocks from the previous crop year) to the estimated production.
It is interesting to note that across the select crops shown, wheat deliveries (excluding durum) at 16.945 million metric tons (mmt) are nearest to the same period in the previous crop year at only 1.2% lower and is the only crop shown where deliveries are above average. Over 36 weeks, producer deliveries are 14.2% higher than the five-year average, which has supported an aggressive pace of export shipments that remains well ahead of the government's forecast pace.
Of the crops shown, canola is the next closest in terms of deliveries compared to recent years. Overall licensed deliveries are down 11% from 2022-23 and down 10% from the five-year average.
P[L1] D[0x0] M[300x250] OOP[F] ADUNIT[] T[]
Producer deliveries of all principal field crops are down 9.5% from one year ago and 1.9% below the five-year average.
When the volume of supplies available for delivery is taken into account, the percentage of deliveries relative to available supplies is ahead of the five-year average for wheat, durum, oats, peas and lentils.
When compared to the historical calculation, the delivery of dry peas and lentils are the furthest ahead, with the delivery of dry peas into bulk handling channels as a percentage of available supplies 10.3 percentage points higher than the five-year average, while the delivery of lentils is 13.2 percentage points higher than the five-year average.
It is important to note this study is based on official estimates from Statistics Canada. Over time, this study can signal issues with the official estimates for stocks or production.
Cliff Jamieson can be reached at cliff.jamieson@dtn.com
Follow him on social platform X @cliffjamieson
(c) Copyright 2024 DTN, LLC. All rights reserved.

Comments
To comment, please Log In or Join our Community .