

Canada Markets
Market Historical Response to the USDA's Late-March Reports
The USDA reported both the Quarterly Stocks report as of March 1 and the Prospective Plantings report today. This report is often released on March 31, or the final trading session of March. There is always a chance of a surprise in this report, especially when it is found in old-crop stocks.
At the extremes, burdensome stocks as of March 1 combined with ideas of another crop coming within the year can weigh heavily on front-month prices, while tight stocks as of March 1 and concerns of new-crop availability being many months away can send front-end prices soaring higher.
P[L1] D[0x0] M[300x250] OOP[F] ADUNIT[] T[]
The largest moves in today's report were seen in corn, with the May contract ending up 15 1/4 cents and the December up 15 1/2 cents. The forecast for 90 million seeded acres in 2024 was a bullish surprise, 2 million acres below the average of pre-report estimates and equal to the lower end of the range.
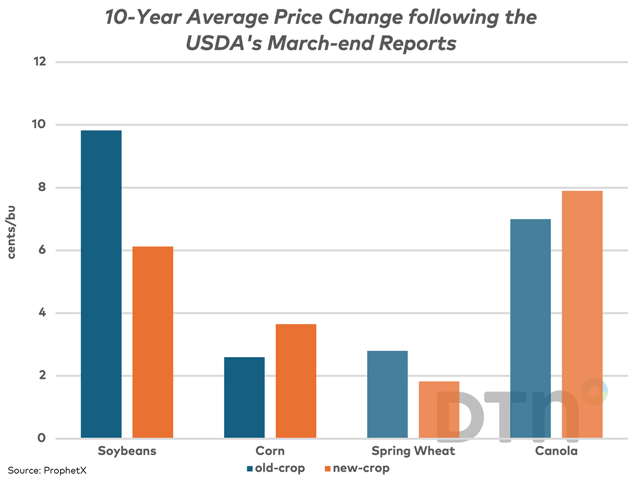
As seen on the attached chart, oilseeds have shown the greatest volatility on average during the past 10 years. From 2014 through 2023, the old-crop soybean contract has gained as much as 70 cents on the day of this report, while has lost as much as 45 3/4 cents. New crop showed even greater volatility, ranging from a high of 31 1/4-cent gain to a 49 3/4-cent loss.
Volatility in canola trade has been extremely low in nine of the past 10 years on this date, although in March 2021, both the May contract and the November contract closed $30/mt higher (68 cents/bu CAD), which coincides with a 70-cent move realized in both old-crop and new-crop soybeans and the only extreme move seen on this date during the past 10 years.
Cliff Jamieson can be reached at cliff.jamieson@dtn.com.
Follow him on X, formerly known as Twitter, @CliffJamieson.
(c) Copyright 2024 DTN, LLC. All rights reserved.

Comments
To comment, please Log In or Join our Community .