

Canada Markets
European Wheat shows favorable Technical Signs
The three wheat markets in the U.S. posted a higher close on Wednesday, reaching a fresh high for the week, but all three continue to trade within the previous week's range in sideways trade.
Not so with the European futures trade, which can be a valuable signal given its proximity and potential to face spill-over demand due to the uncertainty faced in Black Sea exports. In addition, European wheat is seeing support from Euro weakness against the U.S. dollar.
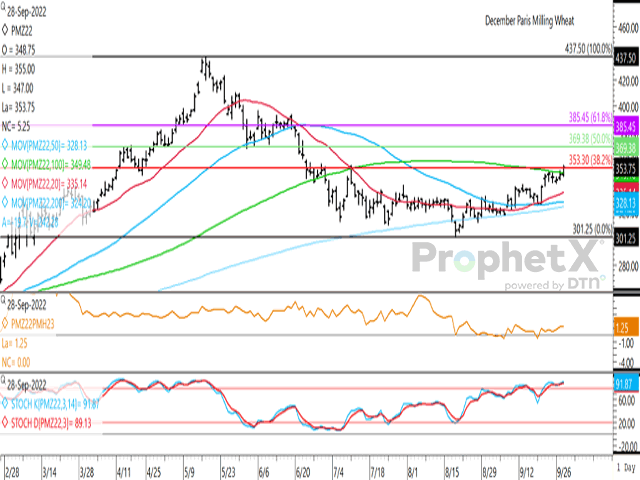
The December contract on the Euronext market closed EUR 5.25/metric ton higher on Sept. 28, reaching its highest trade in over 10 weeks. Today's close ended above its 100-day moving average for the first time since June 29, after failing to sustain a move above this resistance level on Sept. 27.
P[L1] D[0x0] M[300x250] OOP[F] ADUNIT[] T[]
In addition, the close at EUR 353.75/mt landed above the 38.2% retracement of the move from the contract's May 17 high to the August 18 low, calculated at EUR 353.30/mt. A sustained move above this level could result in a continued move to the 50% retracement found at EUR 369.38/mt.
Further resistance from weekly highs lies at EUR 356.25/mt, just EUR 2.50 higher than today's close, while a breach of this level would result in a breakout from the range traded over 14 weeks.
The brown line on the first study shows the Dec/March futures spread inverted at EUR 1.25/mt (December trading over the March), signaling front-end demand. On this date in 2021, this spread was shown at a EUR 6.25/mt inverse, while at a EUR .50/mt inverse in 2020. Over the three years prior to this (2017-2019), this spread traded at a carry of EUR 3/mt to EUR 5/mt on this date. Over the five years, this spread is calculated to average at minus EUR 1/mt.
The lower study shows the stochastic momentum indicators in over-bought territory, which may limit noncommercial buying interest, although the weekly chart (not shown) shows these indicators trending sharply higher, close to the middle of the neutral zone on the chart, while indicating the potential for a continued move higher.
A significant issue in the global market is whether Russia will allow for an extension of the deal to ship Ukraine grain beyond the contracted 120-day period, while global markets may be signaling growing concern and the breach of technical resistance could lead to increased buying interest.
Cliff Jamieson can be reached at cliff.jamieson@dtn.com
Follow Cliff Jamieson on Twitter @Cliff Jamieson
(c) Copyright 2022 DTN, LLC. All rights reserved.

Comments
To comment, please Log In or Join our Community .