

Canada Markets
A Look at Canola's Forward Curve
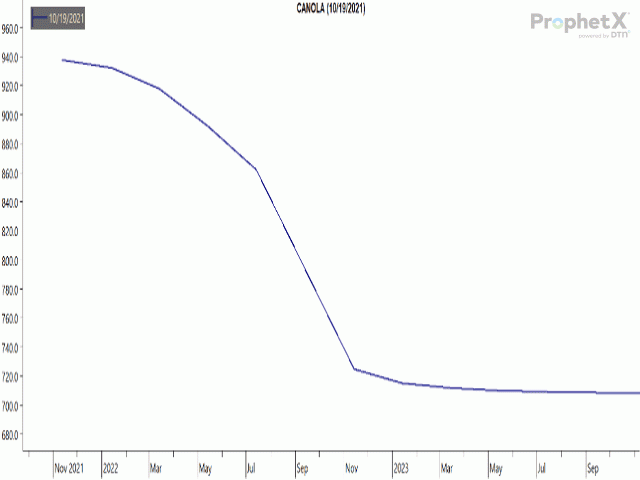
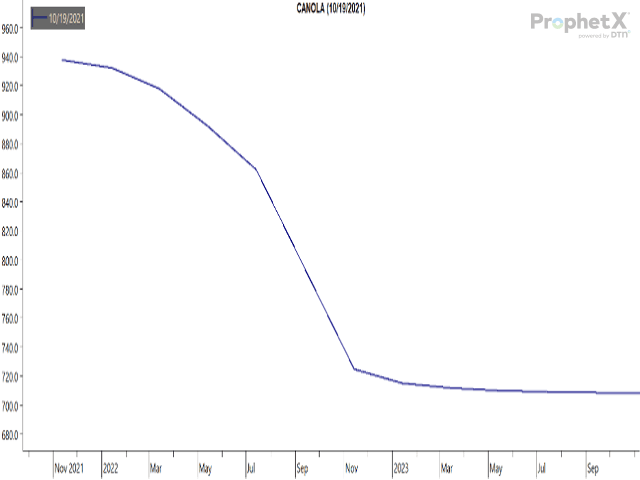
Canola's forward curve continues to reflect a bullish, downward-sloping line on the chart. Each contract is trading higher than the one that follows, signaling firm front-end demand, providing incentive to sell into front-end markets along with little incentive to store grain.
The line on the chart joins the $937.80 metric ton close on Oct. 19 with the $862/mt close for the July 2022 contract, while the line then flattens for the 2022-23 crop year, ending with a $708/mt close for November 2023.
P[L1] D[0x0] M[300x250] OOP[F] ADUNIT[] T[]
The line for the 2021-22 crop year has flattened over time, signaling a less-bullish view of fundamentals, often determined by the actions of commercial traders as they position in future contracts.
The November/July spread closed at $75.80/mt on Tuesday, down from a high of $83.60/mt shown for Oct. 1 and a high of $117.10/mt reached at the Aug. 27 close. While canola's supply situation remains extremely bullish, demand faced so far this crop year has been light.
We can only watch for a change in this trend. The Canadian Grain Commission has reported weekly disappearance at 450,700 mt to 464,700 mt during the past two shipping weeks (crush plus exports), a pace of demand that would eat up the current estimated 14.7 mmt of supplies quickly.
Cliff Jamieson can be reached at cliff.jamieson@dtn.com
Follow him on Twitter @Cliff Jamieson
(c) Copyright 2021 DTN, LLC. All rights reserved.
Comments
To comment, please Log In or Join our Community .