Canada Markets
The Canadian Dollar's Technical Signals
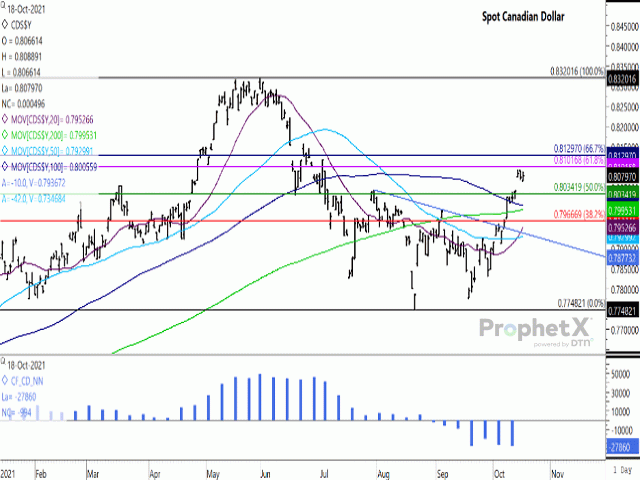
The attached chart shows the spot Canadian dollar move breaking the neckline of an inverted head-and-shoulders pattern, as indicated by the downward-sloping blue line on the chart. The measuring implications for this move would suggest an upside target equal to the distance of the distance from the neckline to the inverted head on the chart, as seen in Aug. 20 trade at $0.774821 CAD/USD. This points to an upside target of $0.8207 CAD/USD, a level not traded since June.
The upward move since Oct. 7 led to a breach of the contract's 200-day moving average, the 100-day moving average, psychological resistance at $0.80 and the 50% retracement of the move from the June high to August low at $0.8034 CAD/USD.
P[L1] D[0x0] M[300x250] OOP[F] ADUNIT[] T[]
The loonie has since sputtered as this exchange neared the 61.8% retracement at $0.810168 CAD/USD, which would be the highest level reached in 15 weeks. A breach of this level could lead to a continued move to the 66.7% retracement at $0.812970 CAD/USD, last breached on June 25.
The histogram bars on the lower study shows investors increasing their bearish net-short position in the Canadian dollar for the fifth time in six weeks as of Oct. 12, now holding he largest bearish position seen since Aug. 25, 2020.
Cliff Jamieson can be reached at cliff.jamieson@dtn.com
Follow him on Twitter @Cliff Jamieson
(c) Copyright 2021 DTN, LLC. All rights reserved.


Comments
To comment, please Log In or Join our Community .