Canada Markets
November Canola is Making its Move
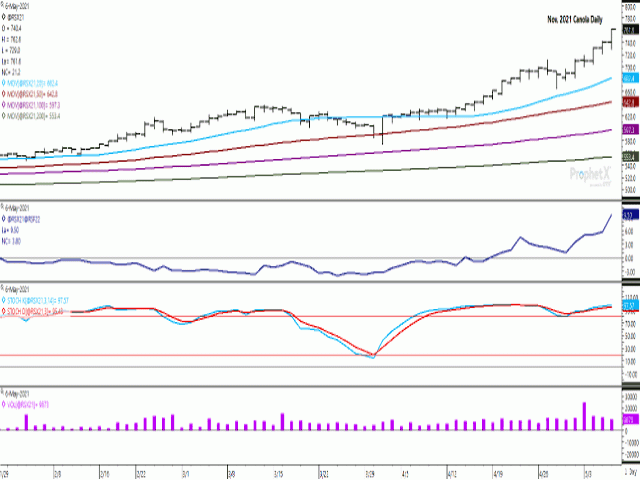
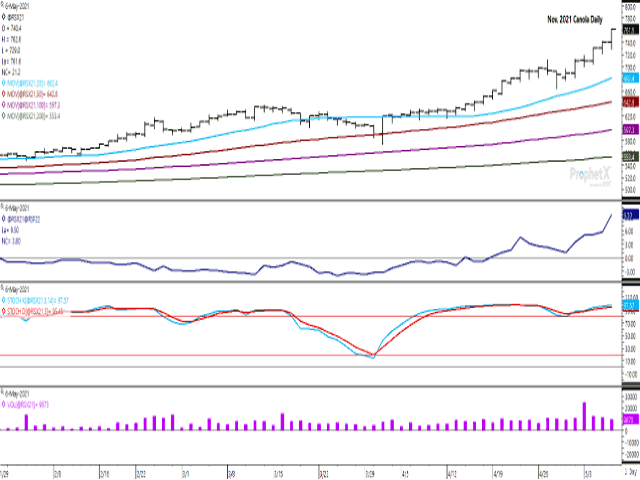
The November canola contract has realized its sixth consecutive higher close on May 6, while not shown on the attached chart, is also poised for its sixth consecutive gain on its weekly chart and the largest weekly gain seen during the life of the contract at $51.40/metric ton after four days of trade.
At the same time, the focus in the canola trade remains on the old-crop trade, as opposed to the soybean trade, where focus has shifted to new crop. For example, the July soybean contract has gained 35 1/4 cents so far this week, which compares to the 69 1/4-cent gain realized for the November contract. July soybean oil has gained 1.96 cents/lb. this week, which compares to the 5.44-cent gain in the October contract. July canola has gained $94.80/mt so far this week, which compares to the $51.40/mt seen in the November contract. This remains a supportive situation for new-crop trade.
While not shown, the continuous November chart shows today's high of $762.60/mt approaching the chart high of $772.10/mt, a move made by the November 2008 contract in March 2008.
P[L1] D[0x0] M[300x250] OOP[F] ADUNIT[] T[]
The blue line on the first study shows the Nov/Jan spread or inverse moving into a weak inverse of $0.30/mt on April 19, while moving from a low of $1.20/mt inverse on April 29 to a close of $9.50/mt on May 6, or just five days. This represents a growing bullish approach to trade and despite the addition of the 2021 crop to the balance sheet. During the past five years, this spread averaged minus $4.84/mt on May 6, while averaging minus $4.34/bu over the past 10 years on this date. Not once has the November traded at an inverse to the January contract on May 6 during the past 20 years.
During the past 20 years, the new-crop Nov/Jan spread has reached an inverse (November trading above the January contract) during the year of contract and prior to harvest just five times. The largest inverse was seen at $5.40/mt and the average across the five years was just $3.04/mt.
The lower study on the attached chart shows how increased highs have been reached on the chart for each of the past three sessions, while daily volume has fallen in each of these days. Selling seems disciplined and for good reason.
While a bullish Statistics Canada March 31 stocks report is expected, this estimate will help shape ideas of where ending stocks could land as of the end of July, which in turn become beginning stocks for 2021-22. The current Agriculture and Agri-Food Canada ending stocks estimate is forecast at 700,000 mt for 2020-21, which is the tightest seen since 588,000 mt was carried out of 2012-13. But what if stocks are even tighter? Ending stocks falling below the 588,000 mt would be the tightest seen since 1997-98 (363,000 mt), while placing even greater emphasis on the 2021 crop potential.
Cliff Jamieson can be reached at cliff.jamieson@dtn.com
Follow him on Twitter @Cliff Jamieson
(c) Copyright 2021 DTN, LLC. All rights reserved.


Comments
To comment, please Log In or Join our Community .