Canada Markets
Canola Reaches New Highs
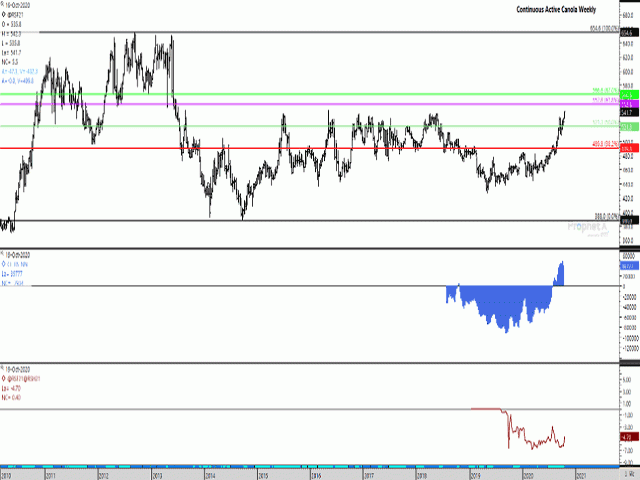
Both the November and January canola contracts reached fresh contract highs on Tuesday, with the most actively traded Jan contract reaching its highest level in just over one month to take out the Sept. 18 high of $541.20 per metric ton (mt) to reach a high of $542.30/mt.
Tuesday's move, that saw the Jan contract close $5.50/mt higher, took out highs reached in April/May 2018, highs reached in February 2017 and highs reached in November/December 2016. As pointed out in Tuesday's Plains and Prairies Closing Comments, Tuesday's high on the continuous active chart is the highest seen since a high of $544.60/mt was reached in May 2016. It is important to note that the continuous weekly chart shows a weekly close of $515.80/mt that week, or $28.80/mt below the week's high. This highlights the risk faced across the grains, with noncommercial traders holding bullish net-long positions and a sudden change in sentiment can lead to a sudden correction.
Should prices hold over the balance of the week, the continuous active chart would reflect the highest weekly close since June 2013, with a weekly close on the Nov contract at $555.90/mt.
P[L1] D[0x0] M[300x250] OOP[F] ADUNIT[] T[]
As seen on this chart, resistance lies at the $544.60/mt high reached in 2016, while also at $552.80/mt, the 61.8% retracement of the move from the September 2012 high to September 2014 low. The 67% retracement of this same downtrend would lead to a potential test of resistance at $566.60/mt. A breach of this level would see prices free of chart resistance until prices reach the 2012-2013 highs in the $650 to $655 range.
The first study shows how CFTC data has not been reported for canola for a long period of time, while noncommercial traders have held a bullish net-long position in canola for the past 11 weeks. The net-long position as of Oct. 13 of 39,777, although down from the previous week, compares to the bearish net-short position of 58,674 contracts this time last year.
The lower study shows the Jan/March spread narrowing by $1.60/mt so far this week to minus $4.70/mt, the narrowest spread or weakest carry seen since early August and is nearing the level where it could be viewed as bullish based on its relationship with full commercial carry.
DTN 360 POLL
This week's poll asks what crop you think has the most bullish potential in the 2020-21 crop year. You can weigh in with your ideas on this poll which is found at the lower-right of your DTN Canada Home Page.
Cliff Jamieson can be reached at cliff.jamieson@dtn.com
Follow him on Twitter @Cliff Jamieson
(c) Copyright 2020 DTN, LLC. All rights reserved.


Comments
To comment, please Log In or Join our Community .