Technically Speaking
Comparing The Current Drop in Corn Prices to 2014
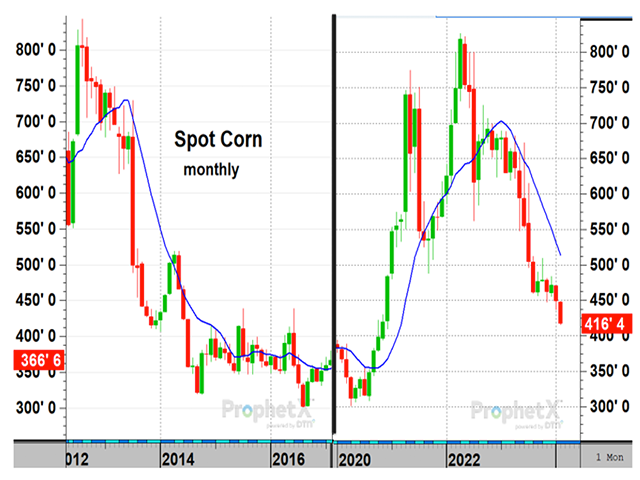
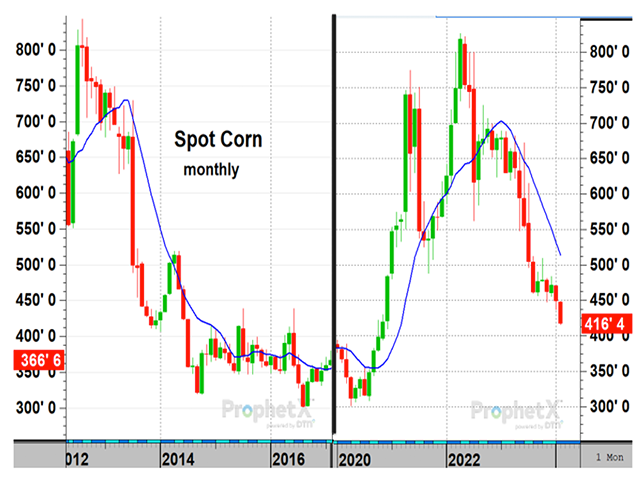
March corn closed at $4.16 1/2 Friday, Feb. 16, losing 12 1/2 cents on the week and posting another new three-year low for spot prices. For corn, the bearish transition from 1.36 billion bushels (bb) of ending corn stocks in 2022-23 to 2.17 bb in 2023-24 continues to weigh on prices and is similar to the bearish transition that took place from 2013 to 2016. After one difficult five-month selloff in 2014, spot corn prices found support at $3.18 a bushel in October and posted a sharp, upward reversal that took prices to a high of $4.39 in July 2015. Adjusting for today's higher production costs, the 2014 prices would translate to October support at $4.20 and a July peak at $5.79 in today's terms.
I'm not suggesting today's spot corn price is going to $5.79 anytime soon, but am making a point that spot prices should be near long-term support and the first clue of finding it could very well be a strong bullish reversal as the market witnessed in 2014 and again, in 2016. The other interesting point of the 2014 example is that the rally took place after a 14.22-bb harvest, a new record high at the time.
P[L1] D[0x0] M[300x250] OOP[F] ADUNIT[] T[]
I don't know where today's corn price will finally find long-term support and what might happen to turn prices higher, but the lesson of 2014 shows it can happen at a time when fundamentals still look bearish. So far, corn prices have closed lower in eight of the past 12 months and there is no sign yet of a reversal taking place. A close in spot corn above $4.53, if it happened, would certainly get the market's attention.
**
Comments above are for educational purposes only and are not meant as specific trade recommendations. The buying and selling of commodities, futures or options involve substantial risk and are not suitable for everyone.
Todd Hultman can be reached at Todd.Hultman@dtn.com .
(c) Copyright 2024 DTN, LLC. All rights reserved.


Comments
To comment, please Log In or Join our Community .