

Technically Speaking
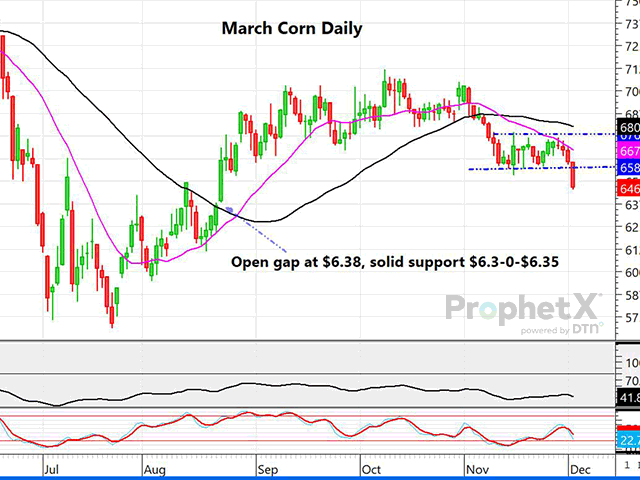
March Corn Breaks Out of 3-Week Range to Downside

With both Ukraine and Brazil corn offers far below those of the U.S., total commitments are down a hefty 48% from a year ago, with shipments down 33%. Until we get into the winter months, it looks like U.S. corn export demand will continue to suffer. It seems very likely USDA will be forced to lower their U.S. corn export projection on next week's WASDE report, potentially by 100 million bushels (mb) or more. The old support level of $6.58 to $6.62 should now provide solid resistance on a correction to the upside. March corn futures on Friday plunged below the three-week range that we have seen since early November, with a new target at $6.38, where an open chart gap exists. Extremely poor export demand, and favorable Brazilian weather appear to be the driving forces weakening corn.
CHICAGO MARCH WHEAT FUTURES:Chicago wheat futures have been on a downward spiral since Oct. 10, and in that time March futures have plunged $1.05 per bushel. U.S. wheat export sales remain abysmal, even with the plunge in price, as both Ukraine and Russia continue to offer the world's cheapest wheat -- and are aggressively doing so. While there is potential for a double-bottom chart pattern to evolve from this, U.S. wheat continues to be undercut, with last week's meager 5.7 million bushels (mb) sold. For the year-to-date, U.S. wheat export sales are lagging last year by 6%, even though at 775 mb the USDA wheat export projection is the lowest in 30 years. One glimmer of hope is that all three wheat markets are deep into the oversold zone, suggesting a correction is possible at any time. Ironically, both U.S. and world wheat supplies remain at 15-year lows.
P[L1] D[0x0] M[300x250] OOP[F] ADUNIT[] T[]
In just the past three days, spot bean oil futures have plunged close to 10 cents per pound, top to bottom. Managed money funds got caught long over 100,000 contracts near the top and have run for the exit doors. Although palm oil has also fallen and Ukraine and Russia are aggressively offering sunflower oil at a sharp discount to U.S. bean oil, the longer-term outlook for soybean oil continues to be bullish, with the renewable biodiesel capacity on a move higher. The 60- to 62-cent area on January should be one of solid support on the chart, but a fall under $.60 could spell more troubles for the bean oil longs.
**
Comments above are for educational purposes and are not meant to be specific trade recommendations. The buying and selling of grain and soybean futures involve substantial risk and are not suitable for everyone.
Dana Mantini can be reached at Dana.Mantini@DTN.com
Follow him on Twitter @mantini_r
(c) Copyright 2022 DTN, LLC. All rights reserved.
Comments
To comment, please Log In or Join our Community .