Technically Speaking
US Dollar, Crude in Focus
After an impressive run through all of 2021 and most of 2022 to date, the U.S. Dollar Index (USD) has slipped into at least a bull market correction. The trick now is to determine whether the current corrective phase is merely another bull market correction ahead of another round of new highs or whether the highs set on May 13 started a new phase for this market. On a daily chart, we do see a very well-defined bearish divergence in momentum as the stochastic measure of momentum peaked around April 26 while price made new highs a couple weeks later on May 13. By then, momentum indicators had turned down. It could be argued this divergence was confirmed with trade below the 103.9420 corrective lows. We would be even more convinced of this divergence if price takes out the 50-day moving average at 101.3532 during this week's trade. If that does indeed occur, the next level of support for the USD would be former resistance turned new support from the March highs between 98.9650-99.3690. To negate this more bearish tilt, we would want to see recovery above the May 5 corrective lows on the way to a resumption of highs above 105.0050. Otherwise, a bearish bias is advised with weakness down to the 99.00-100.00 expected.
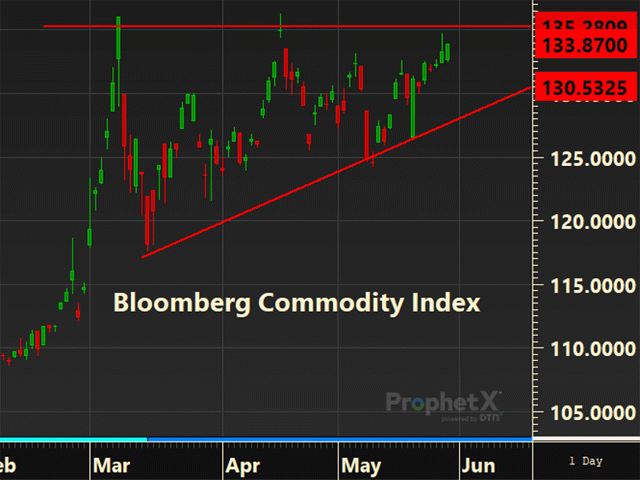
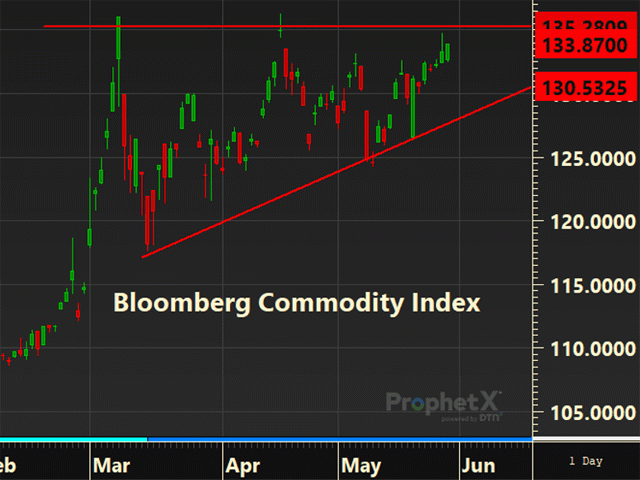
BLOOMBERG COMMODITY INDEX:When talking about the USD, commodity indices such as the Bloomberg Commodity Index (BCOM) often go hand in hand. When looking at the daily chart of the BCOM, we see an impressive rally followed by the consolidative ascending triangle formation. An ascending triangle is consolidative by its very nature, but usually resolves itself with a breakout in the direction of the trend heading into the triangle. In this case, a breakout higher would be expected to continue the dominant trend higher. To try to support this view, it is helpful to look at other indicators. Momentum indicators are trending up and are showing no sign of a divergence with the underling price. A look at shorter-term momentum as price nears the highs around 136.00 will be important. On balance volume is in positive territory and trending steady to higher, a sign bulls are in control at the moment. The underlying commodities within the BCOM are the dog while the BCOM is the tail, so it is important to remember the individual contracts, especially crude oil, will have the ultimate say. As a view on the whole commodity sector, however, the BCOM looks strong provided there is no failure at the top end of the range.
P[L1] D[0x0] M[300x250] OOP[F] ADUNIT[] T[]
Talking about the BCOM would not be complete without discussing the largest piece of the index, crude oil. Spot crude oil futures remain strong with the short, intermediate and long-term trends all pointed higher. To that end, crude is above the 50-, 100- and 200-day moving averages with momentum indicators rising. At present, there is no hint of a bearish divergence between momentum and the underlying asset. With the breakout overnight above the March 24 highs, it looks likely we will see a revisit of the March 7 highs at 130.50. On-balance volume also remains in an uptrend and solidly in positive territory as one would expect given the price action over the last three weeks. The analysis does not need to be any more complicated as trends are up and will remain up until threatened by trade below a corrective level of merit. From a very short-term perspective, we would need to see trade below 115.56 but more preferably 109.09 to move to a neutral or sideline policy.
**
Comments above are for educational purposes only and are not meant as specific trade recommendations. The buying and selling of grain or grain futures or options involve substantial risk and are not suitable for everyone.
Tregg Cronin can be reached at tmcronin31@gmail.com
Follow him on Twitter @5thWave_tcronin
(c) Copyright 2022 DTN, LLC. All rights reserved.


Comments
To comment, please Log In or Join our Community .