Technically Speaking
July Corn's Bearish-Looking Chart: Is It Real or a Fake-out?
While fundamentals remain more bullish than bearish, the sharp plunge in corn values throughout much of May and the first week in June seems strange. Granted, the U.S. corn planting pace picked up considerably last week and the follow-up rains likely have the current corn condition above average, which we'll see on Monday's USDA Crop Progress report. However, the fact remains that the U.S. is well positioned to take advantage of Ukraine's absence from world markets.
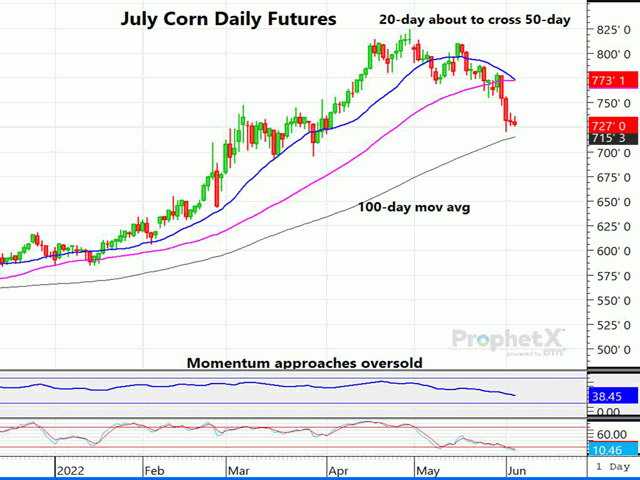
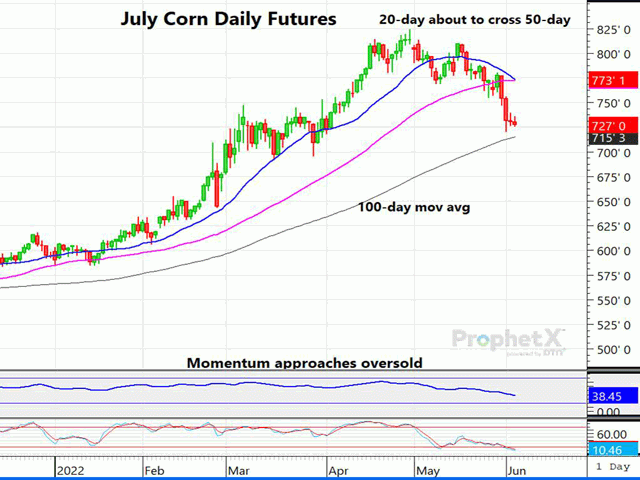
Taking a look at Friday's closing chart on July corn shows some real bearish indicators. July corn is trading well below the 50-day moving average and the 20-day moving average has crossed (barely) below the 50-day average. The latter is typically -- but not always -- a trend-change indicator from past experience. The last time such a crossover occurred was back on 10/25/21, when the 20-day crossed the 50-day to the upside. That resulted in a rally of nearly $2.75 cents to the corn peak on April 29, 2022.
I have also seen this crossover result in a fake-out, where no such reversal occurs. It is risky, but I'm going to go out on a limb and say this bearish-looking July corn chart is just such a fake-out. I believe there is more upside in the corn market. We shall see. However, there is no denying the current corn chart does not exude confidence for bullish traders, but the market is getting very oversold.
KANSAS CITY JULY FUTURES:Similar to corn futures, July KC wheat futures have seen price erode by $2.67 per bushel just since mid-May, even while world wheat fundamentals remain bullish. The weakness has come partly from the beneficial rains we have seen in the previously drought-impacted Western and Southern Plains, and the notion that Russia would cooperate in allowing a shipping corridor to open for Ukraine to export grains. Just ahead of the Wednesday meeting between Turkey and Russia to discuss this, it seems the likelihood that Russia will allow such a corridor even as it ramps up attacks on Ukraine, is beginning to look like a pipe dream.
P[L1] D[0x0] M[300x250] OOP[F] ADUNIT[] T[]
The KC July market is approaching very oversold conditions and the market remains in an uptrend despite the recent plunge. Although this is the wrong time to rally as harvest ramps up, it seems wheat markets still have plenty of upside potential, assuming Ukraine is not allowed to resume wheat exports soon.
JULY SOYBEAN FUTURES:Still a double-top, or is the July soybean chart an "ascending" triangle chart formation? The former is bearish, while the latter is typically a continuation pattern in the existing trend. There is no doubt the existing trend is bullish. A rally and solid close above $17.50 would likely lead to another leg higher in the soy market. However, that $17.40 to $17.50 level will continue to provide solid resistance until it is breached.
Only time will tell where this market will resolve. Keep an eye on $17.50 to the upside, and a break of $16.50 on the downside, to see where we go from here. Soybean fundamentals remain mostly bullish and the fact that China has re-opened their locked-down major cities should be a boost for demand.
**
Comments above are for educational purposes only and are not meant as specific trade recommendations. The buying and selling of grain or grain futures or options involve substantial risk and are not suitable for everyone.
Dana Mantini can be reached at Dana.Mantini@DTN.com
Follow him on Twitter @mantini_r
(c) Copyright 2022 DTN, LLC. All rights reserved.


Comments
To comment, please Log In or Join our Community .