Technically Speaking
A Conflicting Time for Soybeans
U.S. SOYBEANS:
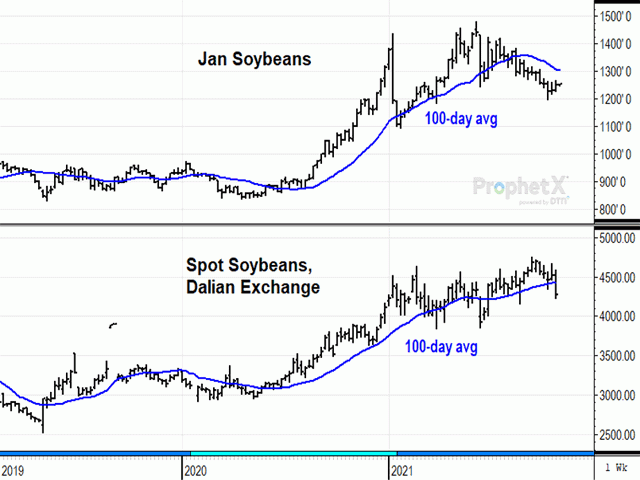
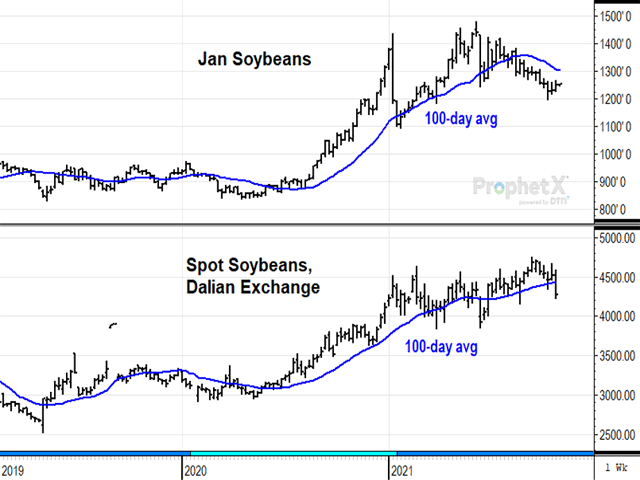
January soybeans closed up 18 3/4 cents on the week, ending Friday and the month of October at $12.49 1/2. With USDA estimating a record soybean harvest of 4.448 billion bushel (bb), January soybeans have traded below their 100-day moving average consistently since Aug. 19, 2021, but have shown a small recovery since hitting a low of $11.95 3/4 on Oct. 13. The weekly stochastic may be in the process of turning higher, but I can't say that soybeans' downward momentum has been broken just yet. Noncommercial net longs have seen a lot of liquidation since early May and are now below 44,000, a more neutral position that hints prices should be close to support near $12.00.
SPOT SOYBEANS ON THE DALIAN EXCHANGE:
P[L1] D[0x0] M[300x250] OOP[F] ADUNIT[] T[]
January soybeans on the Dalian exchange were down 1% last week, ending at the equivalent of $18.18 a bushel. Technically, the weekly close was bearish as it was only the second time spot soybeans closed below their 100-day average in 2021. The first time was a brief sell-off in June, prompted by concerns about the spread of the Delta variant across China. This time appears to be influenced by concerns about China being able to generate enough power to keep industries going through winter. On the bullish side, soy product prices in China are high enough to entice increased crush so it is difficult to know how bearish the recent sell-off in soybeans will be. With China's soybean price currently $5.69 a bushel higher than the U.S. price, there is still room for the two prices to narrow, even with this year's higher shipping costs, and still be wide enough to encourage more imports from the U.S. Just how many U.S. soybeans China buys this year remains difficult to guess and will be the major factor for U.S. soybean prices.
SHANGHAI COMPOSITE INDEX:
Adding to concerns about the possibility of China's slowing economy, the Shanghai Composite Index fell 2% last week to 3,518 yuan. Friday's close fell below the 100-day average and was also the lowest in two months. December copper is also heavily influenced by economic activity in China, and it closed down 3% last week but is still above its 100-day average. In mid-October, China's government reported GDP grew at an annual rate of 4.9% in the third quarter, a slower pace than seen in the second quarter. Technically, the Shanghai Index left behind a double-top near 3,700 yuan and Friday's lower close shows a bearish break in momentum that has largely been bullish since June 2020. The index looks due for a correction and that could also be part of the bearish pressure seen on China's soybean price, described above.
Comments above are for educational purposes only and are not meant as specific trade recommendations. The buying and selling of grain or grain futures or options involve substantial risk and are not suitable for everyone.
Todd Hultman can be reached at: Todd.Hultman@dtn.com
Follow him on Twitter @ToddHultman1
(c) Copyright 2021 DTN, LLC. All rights reserved.


Comments
To comment, please Log In or Join our Community .