

Technically Speaking
Weekly Analysis: Corn and Soybean Markets
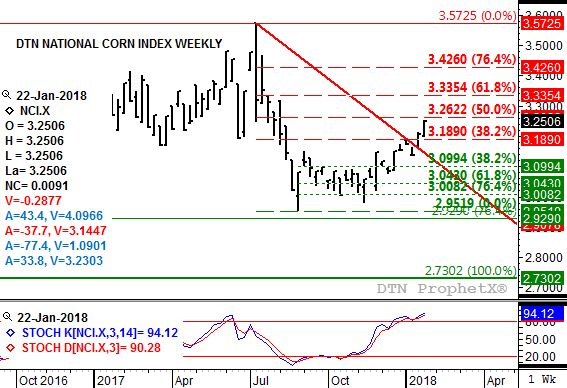
Corn (Cash): The DTN National Corn Index (NCI, national average cash price) closed at $3.25 1/4, up 4 1/4 cents for the week. The NCI remains in a secondary (intermediate-term) seasonal uptrend on its weekly chart. However weekly stochastics are above the overbought level of 80%, in position for a bearish crossover, as the NCI tests resistance at $3.26 1/4. This price marks the 50% retracement level of thee previous downtrend from $3.57 1/4 through the low of $2.95 1/4. Given the continued bearishness of futures spreads, a 50% retracement could be as much as cash corn can rally for this move. Cash corn's 4-year seasonal index has an upside target (weekly close only) of $3.35 in early June.
Corn (Old-crop Futures): The July 2018 contract (analyzed for DTN Strategy purposes) closed 4 1/4 cents higher at $3.73 1/4. The contract remains in a secondary (intermediate-term) uptrend, posting a new 4-week high of $3.74 1/2 last week. Next resistance is at $3.79, a price that marks the 23.6% retracement level of the previous downtrend from $4.34 1/4 through the recent low of $3.62. National average basis (NCI minus futures) versus the July contract (for DTN Strategy purposes) held steady last week at 48 1/4 cents under.
P[L1] D[0x0] M[300x250] OOP[F] ADUNIT[] T[]
Corn (New-crop Futures): The December 2018 contract closed 3 3/4 cents higher at $3.89 1/2. Dec corn's secondary (intermediate-term) trend remains up as the contract posted a new 4-week high of $3.90 3/4. This was a test of initial resistance near $3.91, a price that marks the 23.6% retracement level of the previous downtrend from $4.29 1/2 through the low of $3.79 1/4. The 38.2% retracement level is up at $3.98 1/2, with new-crop corn's 5-year seasonal index target (weekly close only) at $4.15 in early June. Weekly stochastics are bullish above the oversold level of 20%.
Soybeans (Cash): The DTN National Soybean Index (NSI, national average cash price) closed at $9.17, up 8 cents for the week. The weekly close-only chart for the NSI remains trendless, with resistance at the recent high weekly close of $9.21 3/4 (week of November 27) and support the low weekly close of $8.81 1/4 (week of December 18). A close outside this range should reset the secondary (intermediate-term) trend. The market's minor (short-term) trend turned down late last week on its daily chart.
Soybeans (Old-crop Futures): The May contract (analyzed for DTN Strategy purposes) closed at $9.97, up 8 1/2 cents for the week. The market remains in a wide-ranging secondary (intermediate-term) sideways trend on its weekly chart with resistance at the high of $10.37 1/4 (week of December 4) and support the low of $9.55 3/4 (week of January 8). The contract established a minor (short-term) downtrend on its daily chart with support pegged at $9.91 1/4, $9.84 1/2, and $9.77 3/4. National average basis (NSI minus futures) weakened by 1/2 cent last week to 80 cents under the May last Friday.
Soybeans (New-crop Futures): The November 2018 contract closed at $10.02 3/4, up 6 3/4 cents for the week. Similar to old-crop futures, new-crop November remains in a wide-ranging secondary (intermediate-term) sideways trend between the high of $10.24 (week of December 4) and the low of $9.67 1/2 (week of January 8). The contract's minor (short-term) trend turned down late last week with targets of $9.97 3/4, $9.92 1/2, and $9.87 1/4.
To track my thoughts on the markets throughout the day, follow me on Twitter: www.twitter.com\DarinNewsom

Comments
To comment, please Log In or Join our Community .