

Technically Speaking
Third Time is a Charm for Soybeans

Why am I blogging about soybeans again, since the last two intra-week updates have been about November beans and January beans respectively? I have three good reasons: 1) New-crop July winter wheat is quietly building a secondary uptrend on its weekly charts 2) Corn continues to do next to nothing, and 3) I forgot. Yes, number 3 is the main reason for this third consecutive blog about soybeans. But to change it up a bit, this time we'll take a look at some interesting short-term developments in the old-crop March contract.
First, take note of what happened over the recent three-day holiday weekend. Last Friday saw March beans post a high of $9.62 3/4. Markets closed early, then didn't open again until this past Tuesday morning. The contract had an opening price, what would be its low price of the day, of $9.63. This left a small price gap above Friday's high, one indication that short-term bullish momentum was building.
P[L1] D[0x0] M[300x250] OOP[F] ADUNIT[] T[]
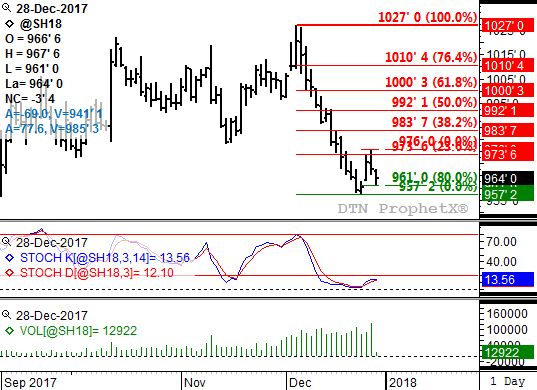
Wednesday's session saw the contract climb as high as $9.76, breaching initial resistance near $9.73 3/4 in the process. The latter price marks the 23.6% retracement level of the previous sell-off from $10.27 (December 5) through last Friday's low of $9.57 1/4. Note, then, that Wednesday saw March beans actually close lower for the day, setting the stage for follow-through selling overnight into Thursday morning.
Which is exactly what happened. The contract opened Wednesday night at $9.66 3/4, down 3/4 cent from Wednesday's close, before falling to a low of $9.61. What is important about that last price? Take a close look. Notice that it closed the small price gap between Friday's high and Tuesday's low. But that in and of itself isn't overly bearish.
What looks to be going on in March soybeans is a fast moving standard 5-wave uptrend. Wave 1 was the move from Friday's low ($9.57 1/4) through Wednesday's high ($9.76), with Wave 2 the fall back to the overnight low ($9.61). Typically, Wave 2 tends to retrace nearly all of Wave 1 and in this case the low amounted to an 80% retracement of Wave 1. Again, this is a standard retracement. From here it will be interesting to see if bullish momentum starts to build again, bringing daily stochastics (second study) into play.
As the contract posted its low last week, daily stochastics were in single-digits indicating a sharply oversold situation. Tuesday's rally established a bullish crossover by daily stochastics, meaning the faster moving blue line crossed above the slower moving red line, with both below the oversold level of 20%. I use this as a confirming signal of a change in trend, be it on daily (short-term), weekly (intermediate-term), or monthly (long-term) charts. In this case it signaled the minor trend has become a 5-wave uptrend.
All this makes the next move important. If March soybeans are indeed in a 5-wave uptrend, then Wave 3 needs to move beyond the Wave 1 high. The next retracement target, the 38.2% mark, is up near $9.84. However, a move below last Friday's low would blow all the recently established bullish signals up, sending technical analysts like me back to the drawing board.
To track my thoughts on the markets throughout the day, follow me on Twitter:www.twitter.com\Darin Newsom
Comments
To comment, please Log In or Join our Community .