
Technically Speaking
Monthly Analysis: Grain Markets
Corn (Cash): The DTN National Corn Index (NCI.X, national average cash price) closed at $3.03 1/4, down 6 1/2 cents for the month. The major (long-term) trend remains sideways-to-down. The last three long-term highs have been lower, as have the last two major lows. This would suggest that the August 2016 low of $2.73 is a long-term target. October saw the NCI.X post a range of only 8 1/4 cents as market volatility continues to decrease. Monthly stochastics are neutral-to-bearish near the oversold level of 20% indicating bearish momentum is still possible.
Corn (Futures): The December contract closed at $3.45 3/4, down 9 1/2 cents on the monthly chart. The major (long-term trend remains sideways-to-down. Futures posted a new 4-month low of $3.42 1/2 during October, indicating bearish momentum could continue to build. This is confirmed by monthly stochastics that remain neutral-to-bearish and above the oversold level of 20%. Initial support is $3.39, a price that marks the 76.4% retracement level of the rally from $3.14 3/4 (August 2016) through the high of $4.17 1/4 (July 2017). However, the continued series of lower highs (July 2015, June 2016, and July 2017) combined with lower lows (October 2014, August 2016) would suggest another major low would be expected during the late summer/early fall of 2018.
P[L1] D[0x0] M[300x250] OOP[F] ADUNIT[] T[]
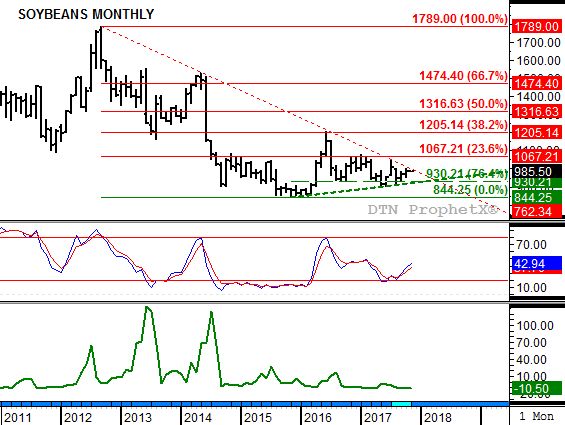
Soybeans (Cash): The DTN National Soybean Index (NSI.X, national average cash price) closed at $8.95 1/2, down 3/4 cent for the month. The NSI.X continues to consolidate within a narrowing range on its monthly chart. Trendline support during November is calculated at $8.63 while trendline resistance drops to $9.12 3/4. Monthly stochastics are neutral-to-bullish near the oversold level of 20% indicating the next move could be a test of trendline resistance.
Soybeans (Futures): The January contract closed at $9.84 3/4, up 16 1/2 cents on the monthly chart. As with the NSI.X, soybean futures remain in a major (long-term) consolidation pattern between converging trendlines. Resistance during November is calculated at $10.07 with trendline support at $9.15. Support could also be found near $9.30 1/4, a price that marks the 76.4% retracement level of the rally from the low of $8.44 1/4 (November 2015) through the high of $12.08 1/2 (June 2016). Monthly stochastics remain bullish indicating upside momentum could continue to build.
HRW Wheat (Cash): The DTN National HRW Wheat Index (HW.X, national average cash price) closed at $3.49, down 17 1/4 cents for the month. Despite October's sharp sell-off the HW.X remains in a major (long-term) uptrend. The market has generally held trendline support connecting the lows from August 2016 ($2.79 3/4) to April 2017 ($3.15 3/4). This support is calculated at $3.43 3/4 during November. Beyond that is the mark of $3.31, the 76.4% retracement level of the rally from $2.79 3/4 (August 2016) through the high of $4.97 3/4 (July 2017).
HRW Wheat (Futures): The December Kansas City (HRW) contract closed at $4.16 1/2, down 26 1/4 cents for the month. The market's major (long-term) trend turned sideways-to-down as futures posted a new 4-month low of $4.13 1/2 during October. Major support is at the August 2016 low of $3.95. Monthly stochastics are neutral-to-bearish above the oversold level of 20% indicating some selling could continue to be seen.
To track my thoughts on the markets throughout the day, follow me on Twitter: www.twitter.com\DarinNewsom

Comments
To comment, please Log In or Join our Community .