
Technically Speaking
A Big Wedgie

If one was so inclined they could summarize the soybean market with, "There's a big wedgie in the beans." They wouldn't be wrong, but most likely they would be looked at rather quizzically.
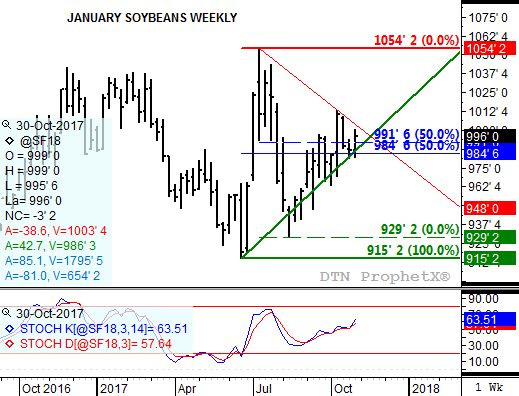
Take a look at the accompanying weekly chart for January soybeans. What you'll see is the convergence of two trendlines, the upper line (thin red line) connecting the highs of $10.54 1/4 (July 10) and $10.13 (October 9). The upward angling green line is Gann's 45* line off the low of $9.15 1/4 from June 19. This line has been tested a number of times, but not closed below. The thin blue line at $9.84 3/4 is the midpoint or the rally from $9.15 1/4 through the high of $10.54 1/4. The dashed blue line the midpoint of the following sell-off from that same high through the low of $9.29 1/4 from August 14.
Note that the contract is running out of room to move as the trendlines converge. This past week's resistance was calculated at $10.03 1/2, support at $9.86 1/4. The coming week sees a tightening range between the lines of $10.00 1/4 and $9.90. As is usually the case with a wedge formation, sooner or later something, either resistance or support, is going to give. The question is, which is more likely to give this time in Jan beans, support or resistance?
To answer that, shift your eyes down to the bottom study: Weekly stochastics. Stochastics measure momentum based on how the contract closes within whatever timeframe's price range is being studied, in this case weekly. Notice that stochastics have slowly been moving up, away from the oversold level of 20% and toward the overbought level of 80%. This indicates that bullish momentum continues to strengthen, meaning the most likely breakout would be to the upside.
How far the contract could run is another possible question. Initial selling interest could be found near the 4-week high of $10.13 (the same high mentioned earlier), and if that gives way a possible full retracement back to the peak of $10.54 1/4. The market's long-term monthly chart shows a major target near $10.67 1/4, a price that marks the 23.6% retracement level of the previous long-term downtrend from $17.89 (September 2012) through the low of $9.44 1/4 (November 2015). For more long-term analysis, see the Technically Speaking blog post from Tuesday, November 1.
To track my thoughts on the markets throughout the day, follow me on Twitter:www.twitter.com\Darin Newsom
P[L1] D[0x0] M[300x250] OOP[F] ADUNIT[] T[]
Comments
To comment, please Log In or Join our Community .