
Technically Speaking
Monthly Analysis: Energy Markets
Brent Crude Oil: The spot-month contract closed at $61.37, up $3.83 on the monthly chart. The market's major (long-term) trend on its monthly chart remains up. Next resistance is pegged at $65.80, a price that marks the 38.2% retracement level of the previous downtrend from $128.40 (March 2012) through the low of $27.10 (January 2016).
Crude Oil: The spot-month contract closed at $54.38, up $2.71 on the monthly chart. The major (long-term) trend now looks to be sideways with resistance at $55.61. This price marks the 33% retracement level of the previous downtrend from $114.83 (May 2011) through the low of $26.05 (February 2016). The previous high was $54.94 from February 2017 with an interim low of $42.05 (June 2017). If the market sees a bullish breakout, next resistance at the 38.2% retracement level is $59.96, then the 50% mark of $70.44. Monthly stochastics already above the overbought 80% level could limit an extended rally.
P[L1] D[0x0] M[300x250] OOP[F] ADUNIT[] T[]
Distillates: The spot-month contract closed at $1.8845, up 7.28cts on the monthly chart. The major (long-term) trend is up with next resistance pegged at 2.1094, a price that marks the 50% retracement level of the previous downtrend from $3.37 (January 2014) through the low of $0.8487 (January 2016). Monthly stochastics are already above the overbought level of 80%, possibly limiting increased buying interest.
Gasoline: The Chicago cash RBOB market closed at $2.1700, up 48.90cts on its monthly chart. The Chicago cash gasoline market remains in a major (long-term) sideways-to-up trend. Chicago cash gas posted a new 4-month high of $2.1868 during October.
Ethanol: The spot-month contract closed at $1.430, down 7.6cts on the monthly chart. The major (long-term) trend remains sideways. Resistance is at $1.712, a price that marks the 23.6% retracement level of the previous downtrend from $3.07 (July 2011) through the double-bottom low of $1.292 (January 2015 and January 2016). Support is at the double-bottom low. Monthly stochastics are neutral-to-bearish, working toward the oversold level of 20%.
Natural Gas: The spot-month contract closed at $2.896, down 11.1cts on the monthly chart. The market looks to be in a wide-ranging major (long-term) sideways trend with support at $2.521 and resistance thee December 2016 high of $3.994. Monthly stochastics remain neutral-to-bearish, but closer to the oversold level of 20%.
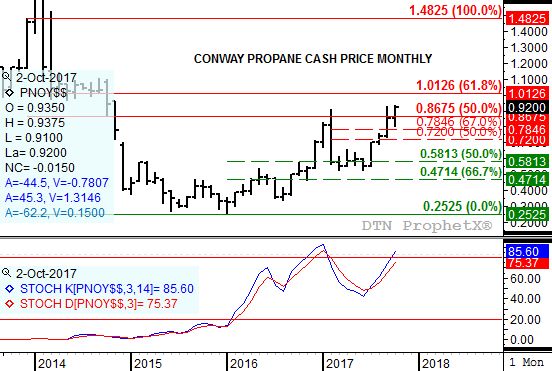
Propane (Conway cash price): Conway propane closed at $0.9200, up 7.00cts on its monthly chart. Cash propane continues to extend its major (long-term) uptrend with next major resistance at $1.0126. This price marks the 61.8% retracement level of the previous downtrend from $1.4825 through the low of $0.2525. Monthly stochastics are bullish below the overbought level of 80%, meaning there is more room to the upside on the market's monthly chart.
To track my thoughts on the markets throughout the day, follow me on Twitter: www.twitter.com\DarinNewsom

Comments
To comment, please Log In or Join our Community .