

Technically Speaking
Monthly Analysis: Livestock Markets
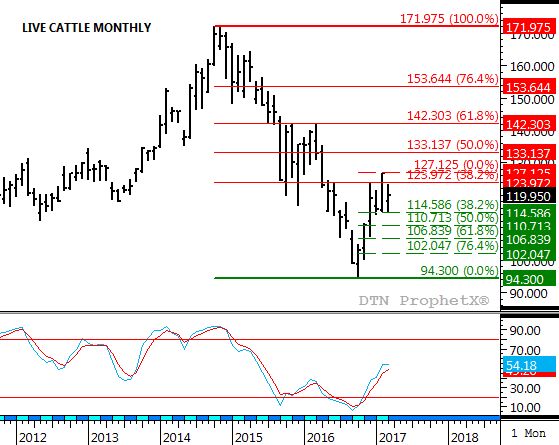
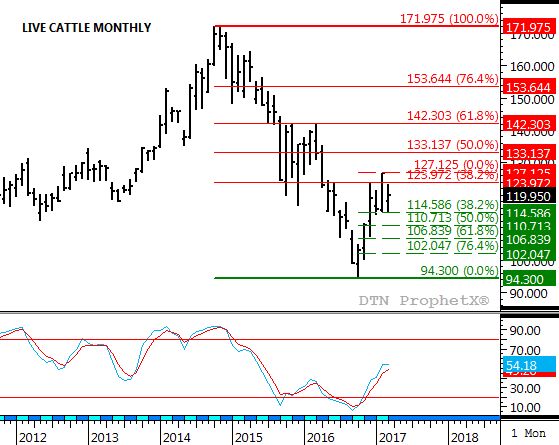
Live Cattle: The nearby April contract closed at $119.925, down $6.65 on the monthly chart. This month's analysis switches to the continuous chart using the nearby contract as opposed to the usual most active. The latter, due to a roll from April to June, creates what looks to be a false bearish reversal due to increase commercial buying in the April leading to a stronger inverse to the June. However, even using this chart the market looks to be entering Wave 2 of a 5-weave uptrend. Normally Wave 2 tends to retrace most of Wave 1, putting a target at the 76.4% retracement mark near $102.05.
P[L1] D[0x0] M[300x250] OOP[F] ADUNIT[] T[]
Feeder Cattle: The May contract closed at $132.70, up $7.625 on the monthly chart. The market appears to be moving quickly through the 5 waves of a normal uptrend with Wave 1 peaking at December's high of $131.55, Wave 2 bottoming at the February low of $120.50, and Wave 3 already extended toward initial resistance near $145.60. This price marks the 23.6% retracement level of the previous downtrend from $245.75 through the low of $114.65.
Lean Hogs: The nearby April contract closed at $65.675, down $1.925 on the monthly chart. It doesn't happen often, but lean hogs look to be trendless on its major (long-term) monthly chart. This means the market could remain range-bound, albeit in a wide range between the high of 75.20 (February 2017) and the low of $40.70 (October 2016).
Corn (Cash): The DTN National Corn Index (NCI.X, national average cash price) closed at $3.26 1/2, down 4 1/4 cents for the month. The major (long-term) trend of the NCI.X remains difficult to classify. The best description could be a long-term sideways trend between the low of $2.81 1/2 (October 2014) and $4.10, a price that marks the 23.6% retracement level of the previous downtrend from $8.26 1/4 (August 2012). Still, the new low (and close) of $2.73 from August 2016 remains a problem.
Soybean meal: The May contract closed at $308.40, down $28.00 on the continuous monthly chart. Meal's monthly chart remains a complicated mix of signals. While it could be argued that the ongoing sell-off is Wave 2 of a major (long-term) uptrend, the current pattern looks to be a 3-wave downtrend of its own. While retracement support is pegged at $299.90, if this is a 3-wave downtrend Wave 2, the nearby contract could fall back to near its major low of $258.90 (February 2016).
To track my thoughts on the markets throughout the day, follow me on Twitter: www.twitter.com\DarinNewsom


Comments
To comment, please Log In or Join our Community .