

Technically Speaking
Monthly Analysis: Grain Markets

Corn (Cash): The DTN National Corn Index (NCI.X, national average cash price) closed at $3.30 3/4, up 6 1/2 cents for the month. While the market continues to indicate it's in a major (long-term) 5-Wave uptrend, the spike low of $2.7302 (August 2016) remains a problem. This took the NCI.X below what was the Wave C low of $2.81 1/2 from October 2014, something not normally seen in an uptrend. Also, the NCI.X continues to deal with a bearish reversal posted during June 2016 as it traded outside the May range before closing lower. Still, the NCI.X established a new 4-month high of $3.41 1/2 during February, generally viewed as a bullish signal.
Corn (Futures): The May contract closed at $3.73 3/4, 14 cents on the monthly chart. The market's long-term monthly chart remains a mix of signals with the last major crossover by stochastics bullish (October 2014) followed by a move to a new low of $3.14 3/4 (August 2016). However, the May contract posted a new 4-month high of $3.86 1/4 during February, a signal that could also be considered bullish (based on the 4-month rule).
P[L1] D[0x0] M[300x250] OOP[F] ADUNIT[] T[]
Soybeans (Cash): The DTN National Soybean Index (NSI.X, national average cash price) closed at $3.53, up 4 cents for the month. The NSI.X still looks to be in a 5-wave uptrend with the October low of $8.77 3/4 the bottom of Wave 2. However, there is also a sideways look to the market with major resistance near $10.27 1/2 continuing to hold. This price marks the 23.6% retracement level of the previous downtrend from $17.47 3/4 through the low of $8.05.
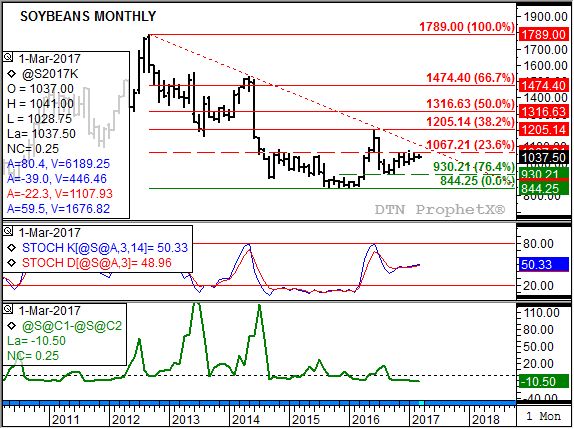
Soybeans (Futures): The May contract closed at $10.35 3/4, up 11 1/4 cents on the monthly chart. While the market remains in a major (long-term) 5-Wave uptrend, it continues to consolidate between resistance near $10.67 1/4 and support near $9.30 1/4. The former is the 23.6% retracement level of the previous major downtrend from $17.89 (September 2012) through $8.44 1/4 (November 2015) with the latter the 76.4% retracement level of Wave 1 from the $8.44 1/4 low through the high of $12.08 1/2 (June 2016).
HRW Wheat (Cash): The DTN National HRW Wheat Index (HW.X, national average cash price) closed at $3.62 1/4, up 23 1/4 cents for the month. The major (long-term) trend remains up as the HW.X posted another new 4-month high of $3.78 1/4 during February. Resistance remains at $4.23 1/4, a price that marks the 23.6% retracement level of the previous downtrend from $8.88 1/2 through the low of $2.79 3/4.
HRW Wheat (Futures): The May Kansas City contract closed at $4.63 1/2, up 34 cents for the month. The market continues to indicate it's in a major (long-term) 5-Wave uptrend, starting with the low of $3.95 from August 2016. May futures posted a new 4-month high of $4.75 during February.
To track my thoughts on the markets throughout the day, follow me on Twitter: www.twitter.com\DarinNewsom
Comments
To comment, please Log In or Join our Community .