

Technically Speaking
Monthly Analysis: Financial Markets
DJIA: The index closed at 18,432.24, up 502.25 on the monthly chart. The market resumed its major (long-term) uptrend with a move, and monthly close, above the previous high of 18,351.36 (May 2015). July's rally built on the bullish outside month posted in June, establishing a new all-time high of 18,622.01, and pulled monthly stochastics back above the overbought level of 80%.
P[L1] D[0x0] M[300x250] OOP[F] ADUNIT[] T[]
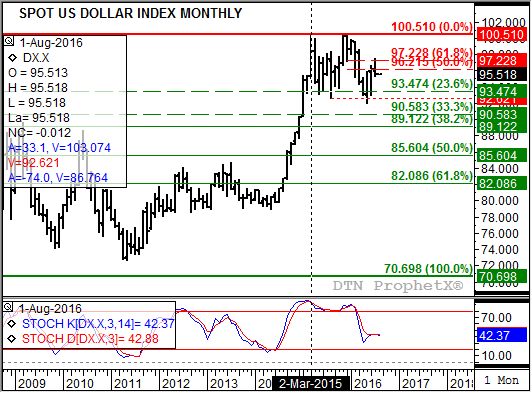
USDX: The index was at 95.530, down 0.613 on the monthly chart. The major (long-term) trend remains down. The recent test of resistance at 97.228 (July high of 97.569) looks to be the peak of Wave B in the ongoing three-wave downtrend. If so Wave C could trough at support between 90.583 and 89.122, levels that mark the 33% and 38.2% retracement levels of the previous major uptrend from 70.698 through the high of 100.510.
Canadian Dollar: The Canadian dollar was at 0.7666, down 0.0044 on the monthly chart. The major (long-term) trend remains up. The recent consolidation on the monthly chart has the loonie holding near support at 0.7601, the 33% retracement level of Wave 1 from 0.6830 (January 2016) through the high of 0.7987 (April 2016). Monthly stochastics remain bullish, indicating Wave 3 could result in a test of the resistance area between 0.89025 and 0.82783.
Gold: The more active December contract closed at $1,357.50, up $36.90 on the monthly chart. The major (long-term) trend remains up with the December contract testing resistance at $1,380.90 (July high of $1,377.50). This price marks the 38.2% retracement level of the previous major downtrend from $1,923.70 (September 2011) through the low of $1,045.40 (December 2015). The 50% retracement level is up at $1,484.60. However, monthly stochastics moved above the overbought level of 80%.
SPGSCI: The commodity index closed at 339.40, down 34.64 on the monthly chart. While the major (long-term) trend remains up, the July sell-off looks to be part of a Wave 2 pullback. After testing resistance at 384.95 in June, the index has fallen to a test of support at 330.32. This level marks thee 50% retracement level of Wave 1 from 268.41 (January 2016) through the high of 392.24 (June 2016). The 67% retracement level is down at 309.64. Monthly stochastics remain bullish.
To track my thoughts on the markets throughout the day, follow me on Twitter: www.twitter.com\DarinNewsom

Comments
To comment, please Log In or Join our Community .