
Technically Speaking
The Long Road Down in the USDX

As most of you know I've been a U.S. dollar index (USDX) bear for more than a year, watching nervously as the Federal Reserve bumped up interest rates last December with promises of more moves on the way. However, as 2016 continues to progress the talk from the Fed is much more dovish, sending the USDX back into the major (long-term) downtrend that began at the end of March 2015.
Back on April 29, 2015 (almost exactly a year, really?) I posted "Doubling Down on the US Dollar Index" that concluded with," And if the USDX is trending down, this could be the catalyst for noncommercial traders to cover some of their net-short futures positions in commodities." At the time, noncommercial traders held net-short futures positions in a number of different markets across the commodity sector. However, this past Friday's CFTC Commitments of Traders report (for the week ending Tuesday, April 26) showed this group still holding net-short futures in only Chicago SRW wheat, Kansas City HRW wheat, and rice. As I discussed in my most recent On the Market column, it's this fund (noncommercial, investment) buying that has sparked the revival of the commodity sector. And much of it is due to the ongoing downtrend of the USDX.
P[L1] D[0x0] M[300x250] OOP[F] ADUNIT[] T[]
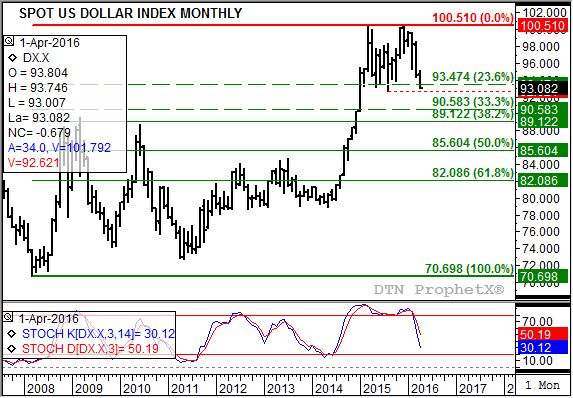
After posting a high, and what I still call a double-top, of 100.510 last December the USDX has been in freefall mode. Friday, April saw a test of 93.000, below initial support pegged at 93.474, with the 12-month low of 92.621 (August 2015) clearly in sight.
What happens if the USDX goes to a new 12-month low? The answer is based on simple double-top pattern analysis. Note that there was 9 months between the initial high of 100.390 (March 2015) and 100.510 (December 2015). Dividing the difference between the two highs (0.120) by the number of months (9) results in roughly 0.013 per month difference. Now note that the interim low of 92.621 was posted 5 months into the pattern, or exactly the mid-point of the double-top. Taking the difference per month (.013) times the number of months in (5) and adding to the original peak gives us a midpoint measurement of 100.457. The difference between that and the interim low gives us a range of 7.836.
Now then, if the USDX sees a bearish breakout by moving below the interim low (92.621) the target would become 84.785 (92.621 - 7.836). Notice on the monthly chart that this would create a test of support at 85.604, the 50% retracement level of the previous major uptrend from 70.698 (March 2008) through the December 2015 high. A move of that magnitude would likely pull monthly stochastics (momentum study) below the oversold level of 20%, setting the USDX up for a possible rally.
But there is a possible twist to the USDX. If we go back to the original double-top pattern we see that it isn't a true double-top since a new high of 100.510 was posted in December 2015. Therefore, it could be argued, that the USDX is in the middle of an expanding triangle top. If so, a move below the interim low may not produce the previously mentioned large round of selling, but possibly more modest activity taking the USDX to the 33% to 38.2% retracement area between 90.583 and 89.122. That could be enough to drag monthly stochastics below the 20% level, setting the stage for a rally back to - get this - a new high beyond 100.510. Then the stage would be set for a long-term collapse in the USDX.
What could be the fundamental catalyst for an expanded triangle pattern versus a double-top? Let's say the USDX continues on its downward path through May and into June, only to have the Fed increase interest rates at its June meeting in response to renewed talk of inflation. The other possibility is the United Kingdom's move to exit the European Union, otherwise known as Brexit. If this occurs the euro could come under heavy pressure sparking another round of buying in the USDX.
The key to how far the USDX falls after breaking to a new 12-month low could be in its momentum indicator - monthly stochastics. If already near the 20% level, continued selling could be limited. If still above, it's possible the sell-off could reach the 50% retracement level.
To track my thoughts on the markets throughout the day, follow me on Twitter:www.twitter.com\Darin Newsom
Comments
To comment, please Log In or Join our Community .