Fundamentally Speaking
U.S. Soybeans Rated 2nd Lowest for 3rd Week in July
As we noted in an earlier piece on Monday, USDA said 54% of the soybean crop was rated good to excellent, one percentage point less than last week and roughly the same as in 2019 when conditions were too wet and again below trade guesses for at least a 1% improvement.
With more stressful weather this week than last likely could see a drop in ratings next Monday, but the question is to what degree.
Using our usual ratings system where we weight the crop based on the percent in each category and assign that category a factor of 2 for very poor, 4 for poor, 6 for fair, 8 for good, and 10 for excellent and then sum the results, the U.S. soybean rating for week 29, or around the third week of July, comes in at 688 which is the lowest since a 574 in 2012 and prior to that, 642 back in 2002.
P[L1] D[0x0] M[300x250] OOP[F] ADUNIT[] T[]
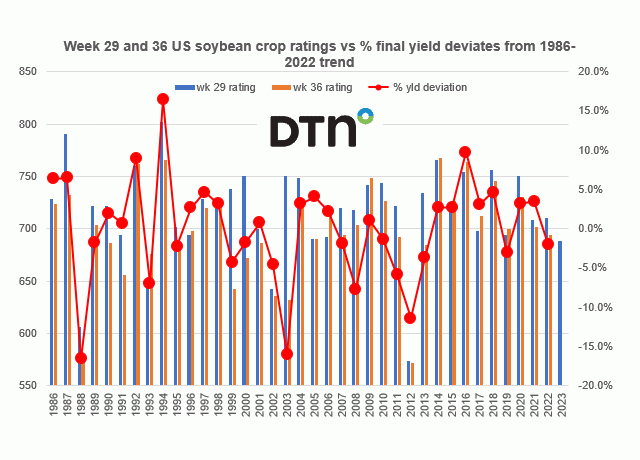
This graphic shows U.S. soybean crop ratings as of week 28 and then on week 36, which is about the second week of September, and after the critical growing month of August on the left-hand axis while reported on the right-hand axis is the percent that the final yield deviated from the 1986-2022 trend.
Using a simple regression based on the relation between week 29 crop ratings and percent yield deviates plugging in this year's week 29 rating of 688 results in a yield 1.9% below trend which this year we calculate to be 51 bushels per acre (bpa) resulting in an estimated yield of 50.0 bpa.
In looking at other years with similar ratings we see in 2019 with the week 29 crop rating of 694, final soybean yields that season came in 3.0% below trend as conditions in 2019 rose just slightly to 700 by week 36.
The 2017 week 29 rating was 698 improving to 712 by week 36 with final yields that season 3.1% above trend.
2005 and 2006 were very similar with week 29 ratings of 690 and 692 and though the week 36 rating was unchanged at 690, final yields that season were 4.0% above trend, while in 2006 the week 36 rating had improved to 716 with yields that season 2.2% above trend.
1991 and 1996 both had week 29 ratings of 694 and while ratings fell by week 36, in 1991 final yields that season were at trend and in 1996 with about unchanged ratings by week 36, final yields were 2.6% above trend.
We'll know a lot more about the crop in seven weeks with the correlation between week 36 ratings and yield deviations 61.3% but that improves to a much better 82.1% by week 36.
We have seen plenty of times where week 29 soybean ratings near this year's level have still produced trend or higher final soybean yields.
(c) Copyright 2023 DTN, LLC. All rights reserved.


Comments
To comment, please Log In or Join our Community .