Fundamentally Speaking
ND and MN See Largest, 2nd Largest Drop in Soybean Area
What a spanking the markets took after the release of the updated acreage and June 1 quarterly stock figures!
I can't even imagine what action would have been like if any of the USDA numbers were really bearish which is not the case.
Soybean numbers were no doubt the most bullish numbers coming in over 2 million acres below trade guess at 88.3 million acres and this compares to the 91 million acres 3/31 intentions figure.
P[L1] D[0x0] M[300x250] OOP[F] ADUNIT[] T[]
Market action over the past week had suggested that heading into the report, trade was looking for lower bean acreage and higher corn but not to this degree and suggests 100 million-acre lower bean output but could see an increase in double cropped acreage after SRW harvest.
Should also note that much of the state declines in bean area from March intentions to Thursday's report was in MN and ND as expected.
USDA noted they will be resurveying MN, ND, SD for changes in planting because 4.03 corn and 15.8 million bean seedings were left to plant in 2022 when the survey stopped.
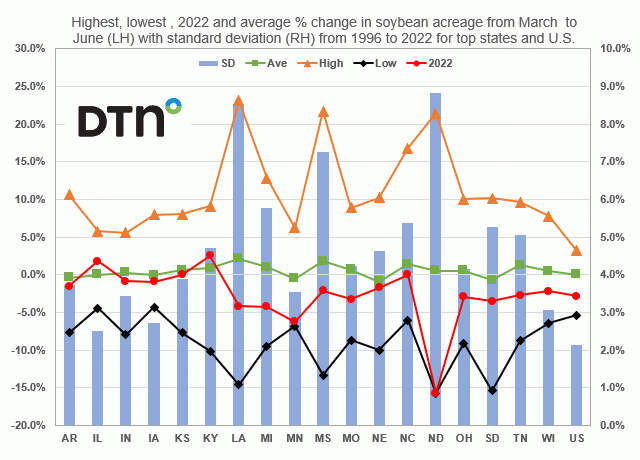
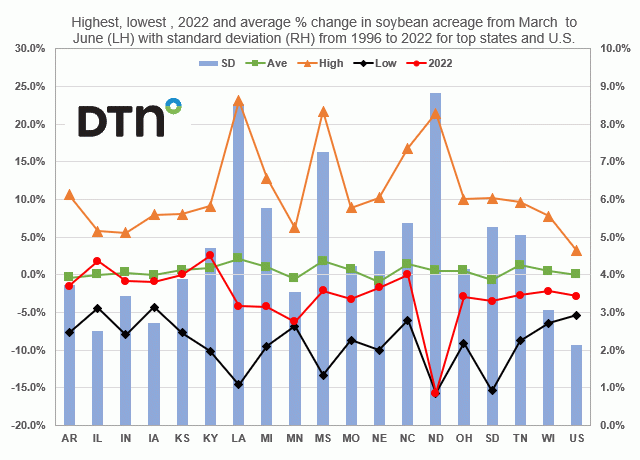
Similar to what we did with corn, this graphic shows the highest, lowest, 2022 and average percent change in soybean acreage from the March prospective plantings report to the June acreage figures on the left-hand axis along with the standard deviation of these changes on the right-hand axis from 1996 to 2022 for the top 18 producing states and the U.S.
Looking at the average percent change, though the 25-year U.S. average acreage change between the March intentions and the June acreage report is close to unchanged, interestingly all but 5 of the 18 top states see an average increase in planted area from the March intentions to the June acreage report.
The largest average percent declines are seen in Nebraska and South Dakota while the largest average increases have occurred in the Delta states of Louisiana and Mississippi.
Similar to corn, North Dakota has the highest standard deviation or has the highest volatility in March to June acreage revisions of 8.8% followed up by Louisiana.
Speaking of North Dakota, this year's 1100-acre or 15.7% drop in planted soybean area from the March to June reports is the largest decline since at least 1996 and the 6.3% drop in Minnesota soybean planted area this year the second largest drop between the two reports in 25 years which is no surprise.
(c) Copyright 2022 DTN, LLC. All rights reserved.


Comments
To comment, please Log In or Join our Community .