Fundamentally Speaking
Current Soybean Meal-Corn Ratio
It is interesting to view the USDA 2022 corn production estimate given in the May WASDE report vs what they had indicated at their Feb Ag Outlook Forum.
Back then they pegged output at 15.240 billion bushels (bb) with planted acreage at 92 million and yield of 181 bushels per acre (bpa) which at that time looked rather aggressive given the 20-year trend is 178.5 bpa.
Now production is seen at 14.460 bb, yield at 177 bpa and planted area the 89.5 mln given in the 3/31 intentions report, a difference of 780 million bushels (mb) while the season-average corn price received by producers is projected at $6.75 per bushel, up 85 cents from a year ago and if realized, the highest since $6.89 reached during 2012/13.
As opposed to corn, USDA has forecast 2022 U.S. soybean production at 4.640 bb based on 3/31 planting figure of 91 million acres and yield unchanged at 51.5 bpa vs. Feb Forum figure of 4.490 bb on same yield but lower seeded area at 88 million acres so output 150 mb better.
P[L1] D[0x0] M[300x250] OOP[F] ADUNIT[] T[]
Partly due to that, U.S. soybean meal prices are forecast down $20 per short ton from 2021/22 to $400 per short ton.
Meanwhile world corn production for the 2022/23 season seen at 1.181 billion metric tons which is down 34.9 million this year with ending stocks 4.3 million lower, while conversely global soybean output for coming year is put at 394.7 million tonnes, up 45.3 million from the 2021/22 season, resulting in ending stocks at 99.6 million metric tons, up 14.4 million from this season.
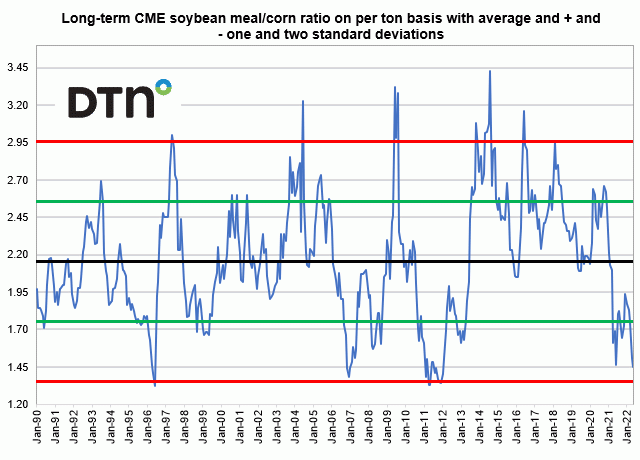
On the surface this would seem bullish for corn and bearish for beans and perhaps this being reflected in the current soybean meal/corn ratio that presently is at one of its lowest levels ever.
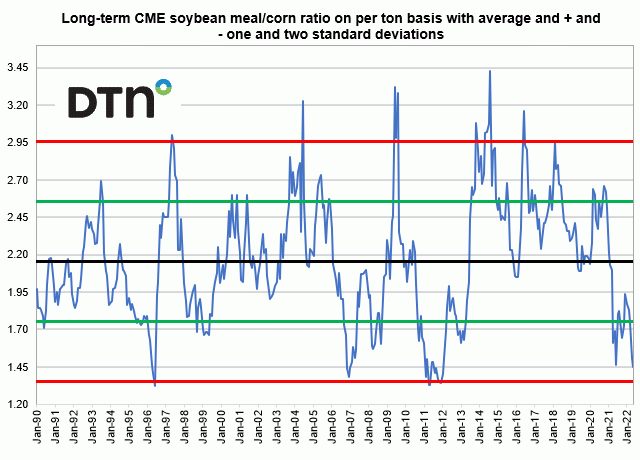
This graphic shows the long-term CME soybean meal/corn ratio on per ton basis with average and plus and minus one and two standard deviations from January 1990 to the present.
The current ratio of 1.45 is well below the long-term average of 2.15, well below the negative one standard deviation level of 1.75 and is very close to the negative two standard deviation figure of 1.35 which is a level where the soybean meal-corn ratio has traded at or below only 2.5% or less of the time over the past 22 years.
Note that a soybean meal/corn ratio this low was last seen in January of 2012, more than ten years ago.
This suggests corn prices are overvalued relative to soybean meal and/or soybean meal undervalued relative to corn.
In most feed rations corn is fed for its energy component and soybean meal fed for its protein content, but soybean meal has some energy so not out of the question that soybean meal could now be fed not only for protein but as a way to get some energy into the rations with substituting it for the high-priced corn.
(c) Copyright 2022 DTN, LLC. All rights reserved.


Comments
To comment, please Log In or Join our Community .