Fundamentally Speaking
Saturated ND and MN Resulting in Lagged Seedings
We've been saying this for a couple of weeks now that we thought the CME markets would have a more positive reaction to the weekly USDA crop progress and condition report figures showing spring wheat and row crop plantings are less advanced than had been anticipated.
Part of this is tied to warmer and drier conditions for the Midwest, but corn and seedings are so delayed that one would expect at least some depressing impact on both planted and harvested acreage and yields.
This is particularly true in North Dakota and Minnesota as they are just so waterlogged that even brief showers will set things back.
The USDA weekly crop progress report this week showed just 9% of the corn crop is planted in MN as of May 8 vs 81% last year and the 48% five-year average while in ND a mere 1% of the corn crop planted vs 33% last year and the 18% five-year average.
Soybeans are in a similar situation with just 2% planted in Minnesota vs 59% last year and the 25% five-year average while in North Dakota no soybeans at all are in the ground as of last Sunday vs 15% last year and the 6% five-year average.
P[L1] D[0x0] M[300x250] OOP[F] ADUNIT[] T[]
This of no small consideration as in recent seasons the combined output of these two states has accounted for more than 13% of both the US corn and soybean total production.
This is nothing compared to their 20% share of the nation's barley output, 25% share of oat production, over half of the country's sugarbeet production and a whopping 2/3rds of the U.S. spring wheat output as each of these crops is also seeing almost unprecedented delays in seedings.
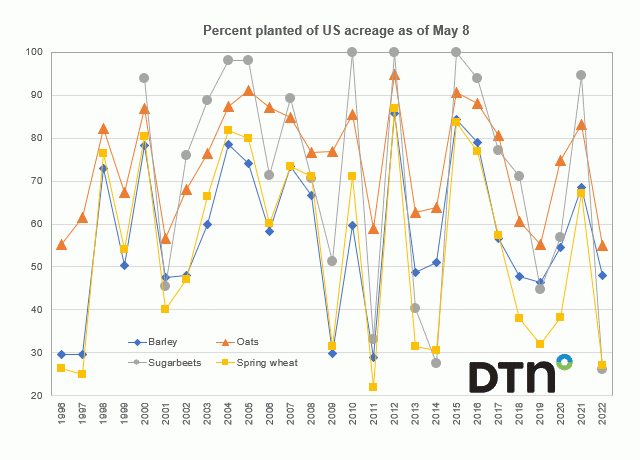
This graphic shows the percent of these key crops that are mostly seeded in the northern part of the U.S. with a large amount in both Minnesota and North Dakota as of May 8th with records going back to 1996 for barley, oats, and spring wheat and back to 2000 for sugarbeets.
Given that other states that produce barley such as ID, MT and WA have seen faster seeding progress due in part to the fact they are much drier, the 48% of barley seeded as of last Sunday is only 12% behind the long-term average of 60% but still tied for 2nd slowest progress since 2011.
For oats, this year's 55% of U.S. acreage in the ground as of May 8th tied with 2019 as the slowest since 1996 while since 1996 only 2011's 22% planted as of May 8 is lower than this year's 27% of the amount of spring wheat planted as of May 8.
The worst however is sugarbeets with just 26% planted, the lowest ever and well below the 2000-2021 average of 72%.
As for impact on yield, barley seems least sensitive, both from the correlation coefficient which is low and in 2011 and 2009 when plantings were most behind as of May 8, yields still came in above trend.
For oats also a rather loose relation though all three years where seedings were not at least 60% complete by May 8, all saw lower than trend yields.
Sugarbeets had the highest correlation between percent of crop seeded by May 8 and percent yields deviated from 20-year trend at 53% with slow seedings in 2011 and 2014 resulting in well below trend yields.
Spring wheat strangest case of all as slow seeding years since 2000 including 2009, 2013, 2014 and 2019 saw yields average a stout 8.7% over the 20-year trend as one must surmise that wet conditions that resulted in a delayed rate of plantings must have benefited the crop later in the year.
(c) Copyright 2022 DTN, LLC. All rights reserved.


Comments
To comment, please Log In or Join our Community .