Fundamentally Speaking
Drought Impact on Winter Wheat Yields
The three large hard red winter wheat producing states of Kansas, Oklahoma and Texas have drawn a lot of attention as to how dry it is in that region of the country and the adverse impact it has had on wheat.
Earlier this week, USDA reported the Kansas winter wheat crop is rated just 25% in the top two categories of good or excellent and 36% in the lower two categories of poor or very poor.
While that is not good at all, it is better compared to Oklahoma's 21% good or excellent and 46% poor or very poor and Texas conditions at a mere 6% good or excellent and 79% poor or very poor.
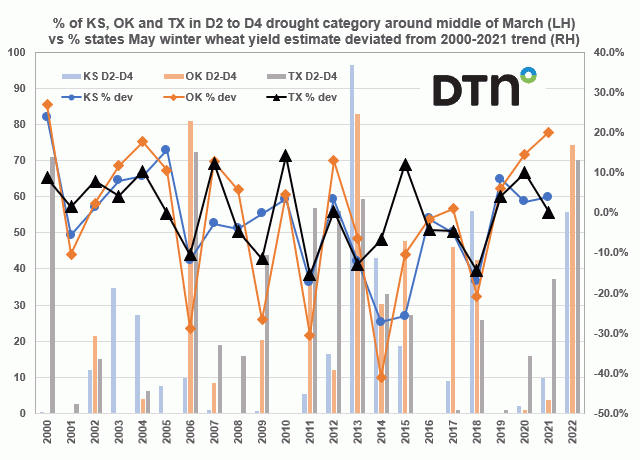
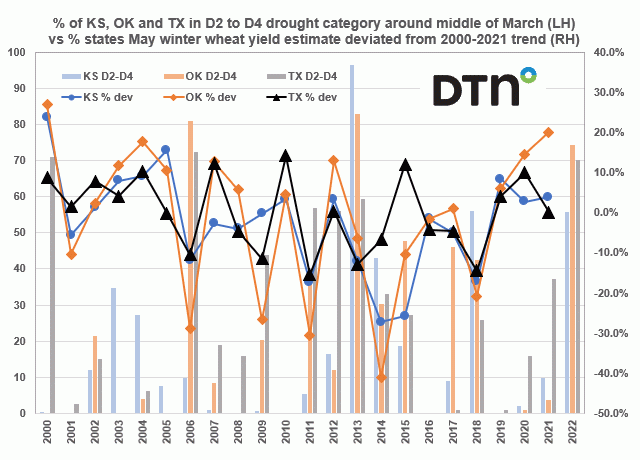
This chart shows the percent of KS, OK and TX in the combined D2 to D4 drought category around the middle of March on the left-hand axis vs. the percent states May winter wheat yield estimate deviated from 2000-2021 trend of final yields on the right-hand axis.
P[L1] D[0x0] M[300x250] OOP[F] ADUNIT[] T[]
The U.S. Drought Monitor maps and statistics report moisture stress as indicated by various levels with D0 considered abnormally dry, D1 indicating moderate drought, D2 indicating severe drought, D3 indicating extreme drought and finally D4 indicating exceptional drought.
Just looking at the combined percent of the state in severe, exceptional, or extreme drought (D2 to D4), the combined area around the middle of March shows KS at 55.85% in this category, the third highest for this time of year in the 21 years of record exceeded by 56.19% in 2018 and 96.41% in the middle of March 2013.
OK last week had 74.46% in the D2 to D4 categories, the third highest next to mid-March 2013 and mid-March 2006 and TX having 70.13% in the D2 to D4 categories, also the third highest next to mid-March 2006 and mid-March 2000.
Clearly the situation is bad right now but is there time for things to improve?
Here we also look at how the May yield estimate deviated from the 2000-2021 trend for final yields with a focus on those years where the combined D2-D4 drought conditions were around or worse than those seen this season.
For Kansas in that 2018 season, the May yield at 37 bushels per acres (bpa) was 17.2% below trend with the final yield at 38 bpa and in 2013 the May yield also at 37 bpa was 12.2% below trend with the final yield also at 38 bpa.
For Oklahoma in that 2013 season the May yield at 30 bpa was 6.3% below trend with the final yield at 31 bpa and in 2006 the May yield at 22 bpa was 28.8% below trend with the final yield at 24 bpa.
For Texas in that 2006 season the May yield at 27 bpa was 10.4% below trend with the final yield at 24 bpa and in 2000 the May yield at 32 bpa was 8.8% above trend with the final yield at 30 bpa.
The sum of it all is while there is time for crop conditions to improve if precipitation does start to arrive, all three states are behind the eightball given how deeply entrenched drought is and the history of having very high combined D2-D4 drought ratings result often in well below trend yields.
(c) Copyright 2022 DTN, LLC. All rights reserved.


Comments
To comment, please Log In or Join our Community .