

Fundamentally Speaking
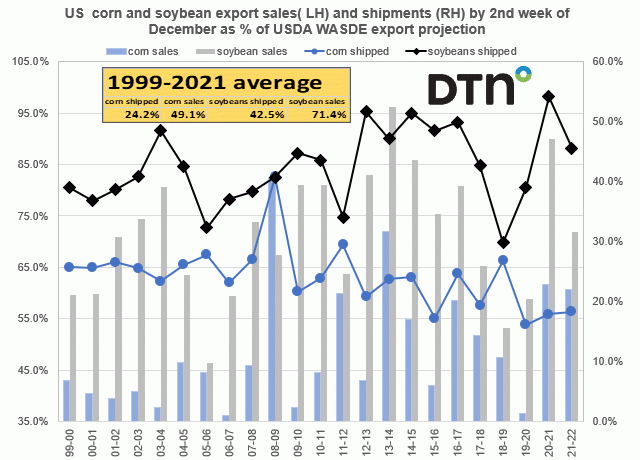
U.S. Corn & Soybean Export Sales
Heading into the new year, a short list of likely market drivers includes the state of growing conditions in South America where the generally sanguine attitude expressed up until now is turning more cautious given a deteriorating weather situation down in southern Brazil and northern Argentina; which crop or crops will get the short end of the stick in next year's acreage battle; and will corn and soybean export projections be lowered as were wheat's last week in the January WASDE report.
With regard to the latter point, this chart shows U.S. corn and soybean export sales as percent of the USDA's December WASDE export projection on the left-hand axis vs. U.S. corn and soybean export shipments as percent of the USDA's December WASDE export projection on the right-hand axis, both using cumulative sales and shipment figures from September 1 to the second week of December.
P[L1] D[0x0] M[300x250] OOP[F] ADUNIT[] T[]
Starting with corn, total sales so far are 1.516 billion bushels (bb) which other than the year ago 1.637 bb figure is the second highest ever and is 60.6% of last week's WASDE projection of 2.50 bb, and this looks to be the fourth highest percent since 1999 and 23.5% higher than the 22-year average sold at this point of 49.1%.
Corn shipments are lagging at 458.4 million bushels (mb) which is only 18.3% of the WASDE projection vs. the 1999-2021 average of 24.2% so this year is down 24.2% from that average and is the fourth lowest percent since 1999.
As for soybeans, total sales so far this marketing year are 1.473 bb, the fourth highest level ever for this point in the marketing year, though just 71.9% of last week's export projection of 2.050 bb vs. the 1999-2021 average of having 71.4% sold by second week of December.
Export shipments of soybeans are 934 mb, 45.5% of the WASDE projection and actually higher than the 1999-2021 average of 42.5%.
What this means to us is despite bean sales lagging year ago levels, both sales and shipments about 30% into the marketing year are on pace to meet the USDA target.
As for corn, sales are above where they should be by close to 25% but the shipment pace is lagging the average by about the same 25%, so will all the corn that has been bought and remains to be purchased leave our shores by August 31 or will some cancellations and inability to make up ground lost from the aftermath of Hurricane Ida result in a lower 2021/22 U.S. corn export sales projection down the road?
(c) Copyright 2021 DTN, LLC. All rights reserved.
Comments
To comment, please Log In or Join our Community .