
Fundamentally Speaking
USDA Revises Corn Feed Demand
One take we had about last Friday's slew of USDA reports was how muted the market response was to all of the numbers.
Perhaps that was due to preoccupation with the signing of the Phase One trade deal with China that reportedly will result in Chinese purchases of up to $40 billion in U.S. farm products each year for the next two years.
One item that caught our attention were some USDA revisions for the 2018/19 U.S. corn balance sheet months after USDA issued its final WASDE report and a year after the final 2018 production report.
We had talked previously about how the surprisingly low 9/1/19 quarterly corn stocks figure, which at the time was attributed to higher than expected corn feed use in the June-Aug 2019 quarter, lead USDA to increase the 2018/19 feed use figure by 125 million bushels (mb), but was probably instead due to an overstatement of the 2018 U.S. corn crop.
I thought this would eventually be revised in the five year census but on Friday the USDA did lower 2018 output albeit with planted acreage lowered by 200,000 to 88.9 million and harvested acreage chopped by 400,000 to 81.3 million as opposed to reducing the current 176.4 bushel per acre (bpa) yield estimate which in itself is interesting.
The final 2018 corn output is now estimated at 14.340 billion bushels (bb), 80 mb lower than what had been projected.
P[L1] D[0x0] M[300x250] OOP[F] ADUNIT[] T[]
Hence feed use in the June-Aug quarter was not as strong as had been thought with the total 2018/19 feed residual figure lowered by 186 mb to 5.432 bb which results in the 2018/19 ending stocks or the 2019/20 beginning stocks increasing by 107 mb to 2.221 bb.
Now with the 12/1/19 quarterly corn stocks figure coming in at 11.389 bb vs. the average trade estimate of 11.511 bb implies that Sep-Nov corn feed demand was record high around 2.640 bb and this is why feed/residual usage was upped by 250 mb in Friday's WASDE report.
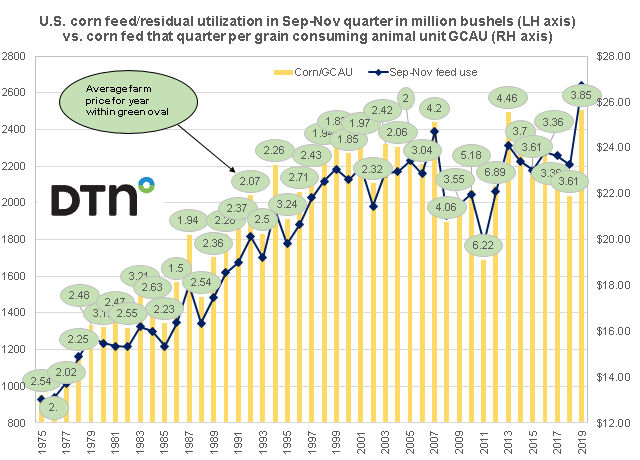
The attached graphic shows U.S. corn feed/residual utilization in the Sep-Nov quarter in million bushels on the left hand axis vs. corn fed that quarter per grain consuming animal unit GCAU on the right hand axis.
We have also attached the average farm price that year in $ per bushel in the green oval.
With feed demand not up to snuff in recent years there is some skepticism that feed/residual demand is that robust.
Some say the lower than expected 12/1/ 20 stocks may be more due to an overstatement of the 2019 crop.
Evidence of that will not be unveiled until the 3/1/20 stocks report at the earliest.
At that time USDA probably will have released the results of their re-survey of five northern states updating their 2019 corn production figures.
We are looking at a 2.1% increase in GCAU's to 102.84 million units from the prior year which is the fourth highest annual percent gain since 1997 and a higher crop often results in a higher residual.
We see that corn fed per GCAU now pegged at an all-time high of 25.67 bushels/GCAU bringing it up to levels seen in 2013/14 and the 2007/08 seasons.
All of this seems to have resurrected the debate about how USDA really lacks a national feed consumption model not only for corn, but the other feed grains and wheat also.
Furthermore, it may be that the less than desirable quality of the 2019 U.S. corn crop may have dampened feed efficiency rates with animals needing to consume more to maintain weight gains.
(KM)

Comments
To comment, please Log In or Join our Community .