
Fundamentally Speaking
U.S. Corn, Beans Planted by May 20th
Already seeing comments that little attention will be paid to the planting intention figures when they are released.
Not only is this just a survey of what farmers 'intend' to put in the ground but spring weather, always a wild card in what the final mix of crops are planted, will have even more bearing this season given forecasts for record spring flooding throughout the Cornbelt.
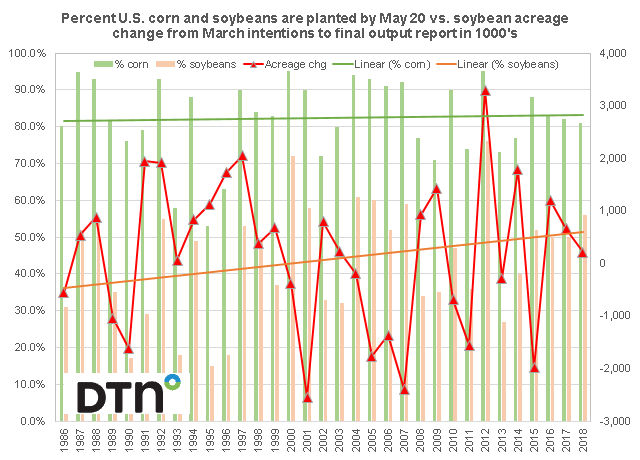
This post looks at the percent of the U.S. corn crop and soybean crops planted by May 20 vs. the acreage change for soybeans from the March prospective plantings report to the final production report in 1000 acres.
We also have included the linear trend for the percent of both corn and soybeans planted by May 20.
P[L1] D[0x0] M[300x250] OOP[F] ADUNIT[] T[]
The 1986-2018 average seeding pace for corn in the ground by May 20 is 82% and the chart shows that this has been pretty steady over the past 32 years as evidenced by an almost horizontal trendline.
Years that we would identify as being late would be 1993 at 58%, 1995 which appears to be the most lagged year at 53%, 1996 at 63%, 2002 at 72%, 2009 at 71%, 2011 at 74% and 2013 at 73%.
Meanwhile the 1986-2018 average seeding pace for soybeans in the ground by May 20 is 44% and the chart shows a distinct increase in this figure with the trend going from 35% to now just over 50%.
No surprise however that the seven years we cite as having late corn plantings also experienced a lagged pace of soybean seedings with an average 26% with 1995 also being the slowest pace of soybean plantings by May 20 at 15%.
Interesting then that the average increase in soybean acreage from the March intentions to the final production report is a mere 468,000 acres for those seven season vs. the full 1986-2018 average of an increase of 187,000 acres.
The largest rise was in 1996 at 1.727 million acres but 2011 saw a decline of 1.563 million acres.
It is likely that late corn seedings that prevented some of that crop from being planted also stymied farmers in their efforts to seed soybeans and instead just claimed these acres as prevented plantings under the crop insurance program.
Also possible are corn prices that were particularly attractive relative to those for soybeans may have kept farmers planting corn well past its optimal planting date.
A final note is that some of the largest March to final soybean acreage increases have occurred when the pace of corn plantings have been quick such as 1992 and 2012 when farmers finished early and were able to seed extra parcels of soybeans.
(KLM)
© Copyright 2019 DTN/The Progressive Farmer. All rights reserved.

Comments
To comment, please Log In or Join our Community .