
Fundamentally Speaking
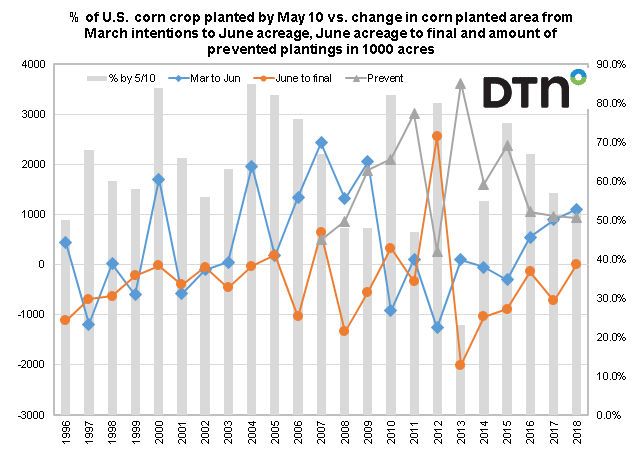
Corn Planted by May 10th vs. Acreage Revisions, Prevented Planting

While scenes of major flooding plays out on TV screens, an update from USDA's Natural Resources Conservation Service (NRCS) shows the winter of 2018-19 was the wettest ever for the U.S.
Record-setting snow fell in the West and upper Midwest, culminating in the second-wettest February on record.
Meanwhile, the U.S. is likely to see "historic, widespread flooding" through May, according to the National Oceanic and Atmospheric Association's spring outlook.
Along these lines this piece looks at the percent of the U.S. corn crop planted by May 10 on the right-hand axis vs. the change in the USDA's corn planted acreage projections from its end of March Prospective Plantings report to the June Acreage projections.
Then from those figures to the final planting numbers given in the annual crop production report released in January.
P[L1] D[0x0] M[300x250] OOP[F] ADUNIT[] T[]
Also plotted are the corn prevented planting data furnished by the USDA's Farm Service Agency, all of which are on the left-hand axis.
The concern this year is that given all the snow yet to melt, heavy rains and still frozen solid soils seedings of the 2019 corn crop will be very slow and if delays persist, some intended corn ground may never get planted.
Since 1986, the average percent of the U.S. corn crop planted by May 10th is 61% and despite talk that the crop is getting planted earlier, a trend of the percent of the U.S. corn crop planted by May 10th has stayed pretty consistent since 1986 at 61% with a standard deviation of 16%.
So years with the percent planted by May 10 of 45% or lower are really late, including 2013 at 23%, 1995 at 27% and 1993 at 21%.
Other slow years include both 2008 and 2009 at 48% and 2011 at 47%.
This chart uses just data from 1996 as the FSA prevented planting figures apparently only go back to 2007.
The largest March to June acreage decline came in 2012, the year of a horrific drought and we imagine that soils that season were so dry farmers may have waited for spring rains to perhaps seed another crop.
1997 and 2010 were other years of sizable corn planted area declines from the March intentions to the June acreage report but plantings of corn those years were rather speedy.
It appears that the June to final acreage revisions do a better job of highlighting the impact of wet springs with an over 2.0 million acres decline in 2013 and 1.345 million in 2008.
The prevented corn planting numbers also show the highest figures for 2011 and 2013.
The point here is that it may be unlikely that the June acreage report will capture the amount of corn acres that were not planted if the wet spring anticipated this year is seen delaying or eliminating corn plantings.
(KR)
© Copyright 2019 DTN/The Progressive Farmer. All rights reserved.
Comments
To comment, please Log In or Join our Community .