
Fundamentally Speaking
Soybean Sales & Shipments as of Mid-February
The USDA In its February 2019 WASDE report lowered its projection for 2018/19 U.S. soybean exports by 25 million bushels (mb) to 1.875 billion bushels (bb) but even that revision looks inadequate to address what is a yawning gap between where current soybean sales are and where they should be for this point in the marketing year.
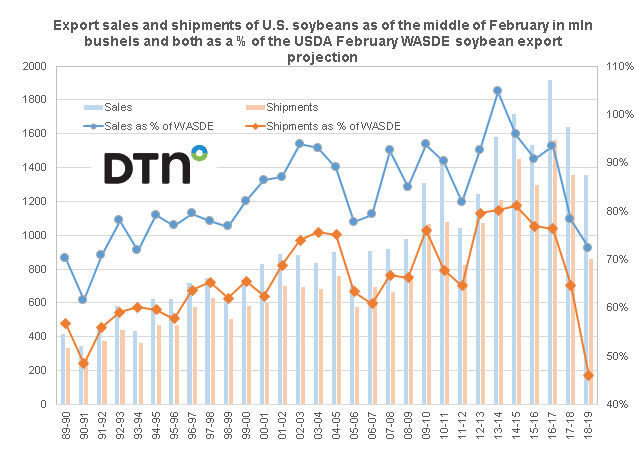
This graphic shows soybean sales and shipments as of the middle of February going back to the 1989-90 season in million bushels plotted on the left hand axis while on the right hand axis are those sales and shipment figures as a percent of the USDA's February WASDE estimate.
P[L1] D[0x0] M[300x250] OOP[F] ADUNIT[] T[]
The USDA released six weeks' worth of export sales data last Friday due to the government shutdown and this brought total soybean sales since the marketing year started September 1 to 1.356 bb which is the lowest figure in itself since the 2012/13 season.
The total amount shipped as of mid-February is 861.1 mb and this is the lowest total for this point in the marketing year since the 2011/12 season.
Even more sobering are those figures as a percent of the 1.875 bb export projection; for sales that is 72.3% and for shipments 45.9%.
The mid-February cumulative sales figure as a percent of the February WASDE export projection is the lowest since a 71.8% figure was seen back in the 1993-94 marketing year, while the percent shipped number is the lowest we have going all the way back to the 1989-90 marketing year.
Note that the 10-year averages are 90.6% and 73.3% respectively, showing that in order to meet the average, our soybean sales should be at least 343 mb higher than where they stand today.
(KLM)
© Copyright 2019 DTN/The Progressive Farmer. All rights reserved.

Comments
To comment, please Log In or Join our Community .