

Fundamentally Speaking
Percent Change in Sep Soybean Ratings

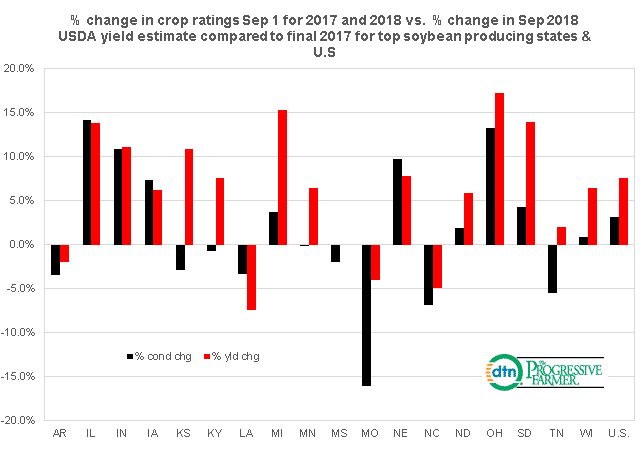
As we did with corn, this graphic shows the percent change in U.S. soybean crop ratings as of 9/1/18 compared to the year earlier 9/1/17 vs. the percent change in the USDA corn yield estimate for September 2018 compared to the 2017 final figures for the top 18 soybean producing states and the U.S.
For soybeans, the direction of the percent change in crop conditions mostly matches the percent change in yields.
P[L1] D[0x0] M[300x250] OOP[F] ADUNIT[] T[]
The exceptions are Kansas where crop conditions are 2.9% below year ago levels, though in September the USDA forecast that states soybean yield 10.8% above the final 2017 figure; Kentucky where the forecasted yield is 7.5% above last year in contrast to crop conditions 0.7% below their 2017 level; and Tennessee where the yield was pegged 2.0% above year ago levels even though this year's crop ratings are 5.5% below year ago levels.
We should also mention a Michigan yield 15.3% above the final 2017 figure when crop conditions are just 3.7% above year ago levels and Missouri yields only forecast 4.1% below last year when crop conditions are 16.1% lower.
Needless to say, USDA has set the bar very high for both corn and soybeans so traders will now start to monitor actual harvest results to see if they match up with the lofty state yield estimates.
(BAS)
© Copyright 2018 DTN/The Progressive Farmer. All rights reserved.
Comments
To comment, please Log In or Join our Community .