

Fundamentally Speaking
Soybean Ending Stocks Matrix
As opposed to past years when the USDA often understated final demand for U.S. soybeans that is certainly not the case this year as a record yielding and producing U.S. crop has been followed up by monstrous South American production with U.S. ending stocks at ten year highs and the global soybean carryout the highest ever.
As bearish as this situation appears, the outlook for prices next year could be even more desultory if intentions by U.S. farmers to seed the highest amount of soybean acres ever proves true.
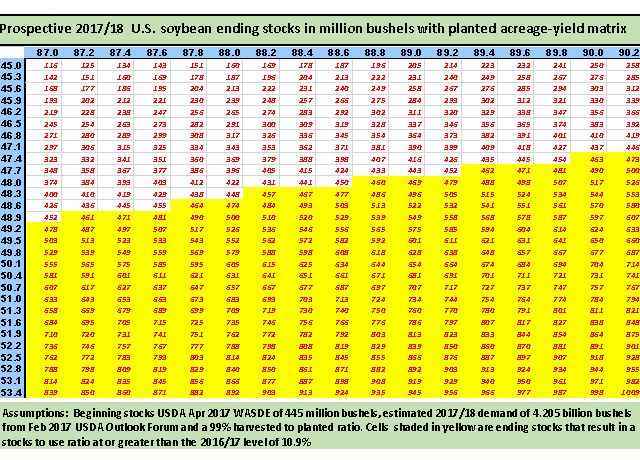
This graphic shows prospective 2017/18 U.S. soybean ending stocks in million bushels per various combinations of prospective acreage and yields.
P[L1] D[0x0] M[300x250] OOP[F] ADUNIT[] T[]
Going across the x-axis is planted acreage in millions while going down the y-axis are possible yields in bushels per acre.
Within the cells is the ending stocks based on the combination of yields, planted acreage, a 99% harvested to planted ratio, beginning stocks at 445 million bushels as given by the just released April 2017 WASDE report and demand at 4.205 billion bushels as given at the USDA's Feb Ag Outlook Forum.
As an example, if 89.0 million acres were planted, with the Feb Outlook yield forecast at 48.0 bushels per acre(bpa), the intersection of that column and row shows a 469 million bushel figure.
The way that is arrived at is taking 89.0 million acres and multiplying that by 99% which is the five year average harvested to planted ratio and then by 48.0 bpa to give a production figure of 4.229 billion bushels.
To that, we add the beginning stocks of 445 million and subtract estimated 2017/18 demand of 4.205 billion bushels, resulting in a 2017/18 ending stocks figure of 469 billion bushels.
The actual USDA soybean prospective planting figure was 89.5 million so splitting the difference between the 89.4 and 89.6 million acre planted with a 48.0 bpa yield cells results in an ending stocks figure of 493 million bushels.
Note that cells shaded yellow have a stocks-to-use ratio equal to or greater than 10.9% which is the current 2016/17 U.S. soybean stocks-to-use ratio suggesting there is quite a bit of room on the balance sheet for any yield adversity.
(KA)
© Copyright 2017 DTN/The Progressive Farmer. All rights reserved.

Comments
To comment, please Log In or Join our Community .