
Fundamentally Speaking
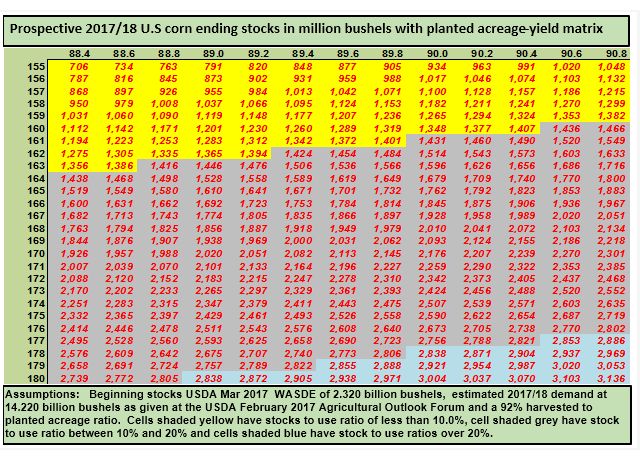
Corn Ending Stocks Matrix
The upcoming WASDE report is expected to show an increase in the USDA's current 2.320 billion bushel carryout for the 2016/17 season which as a percent of consumption of 15.9% is the highest since the 2005/06 season and the ending stocks itself is the loftiest since 1987/88.
The higher than expected March 1 quarterly stocks figure points to a reduction in the current feed/residual estimate of 5.550 billion bushels though both export and industrial utilization figures may be hiked.
Thus even with the four million acre reduction in planted acreage that was seen in the recently released end of March USDA planting intentions report, barring a full-fledged weather disaster, the 2017/18 U.S. corn carryout and stock to use ratio should remain sizable.
This graphic shows the prospective 2017/18 U.S. corn ending stocks matrix in million bushels per various combinations of acreage and yields.
P[L1] D[0x0] M[300x250] OOP[F] ADUNIT[] T[]
Going across the x-axis is planted acreage in millions while going down the y-axis are possible yields in bushels per acre.
Within the cells is the ending stocks based on the combination of yields, planted acreage, a 92% harvested to planted ratio, beginning stocks at 2.320 billion bushels and demand at 14.220 billion bushels as given at the USDA's Feb Ag Outlook Forum.
As an example, the USDA intentions report shows 90.0 million acres planted with the Feb Outlook yield forecast at 171 bushels per acre (bpa).
The intersection of that column and row shows a 2.259 billion bushel figure.
That number is arrived at by taking 90.0 million acres and multiplying that by 92% and then by 171 bpa to give a production figure of 14.159 billion bushels.
To that, we add the beginning stocks of 2.320 billion and subtract estimated 2016/17 demand of 14.220 billion bushels, which results in a 2016/17 ending stocks figure of 2.259 billion bushels and this would equate to a 15.9% stock to use ratio.
Note that cells shaded yellow have a stocks to use ratio of less than 10.0%, cells shaded grey have stock to use ratio between 10% and 20% and cells shaded blue have stock to use ratios over 20%.
(KA)
© Copyright 2017 DTN/The Progressive Farmer. All rights reserved.

Comments
To comment, please Log In or Join our Community .