
Fundamentally Speaking
USDA Ag Outlook Stock Estimates vs. Actual Figures

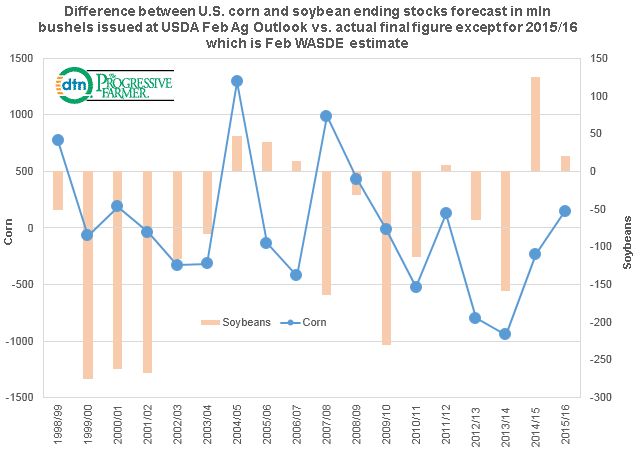
This chart tracks the USDA's estimates of ending stocks given at their Outlook Forum vs. the actual final figures for corn and soybeans. The 2015/16 actual numbers are the February WASDE figures given earlier this month with corn at 1.838 billion and soybeans at 0.450 billion.
There have been some big hits and misses, mostly due to changes in production, but since the 1998/99 season the government has tended to understate corn ending stocks by an average of 13.1% while tending to overstate soybean ending stocks by an average of 23.0%.
For corn it appears that much better production than anticipated is the reason why the USDA often comes in with a lower ending stocks figure than what actually materializes, while in soybeans the USDA has long tended to peg demand far lower than it actually turns out to be.
(KA)
© Copyright 2016 DTN/The Progressive Farmer. All rights reserved.
P[L1] D[0x0] M[300x250] OOP[F] ADUNIT[] T[]
Comments
To comment, please Log In or Join our Community .