Fundamentally Speaking
Grain, Oilseed Futures Volatility Trending Lower

Not to get too technical here but the definition of a standard deviation is a measure of the dispersion of a set of data from its mean.
The more spread apart the data, the higher the deviation.
Standard deviation is calculated as the square root of variance.
In finance, standard deviation is applied to the annual rate of return of an investment to measure the investment's volatility.
Standard deviation is also known as historical volatility and is used by investors as a gauge for the amount of expected volatility.
P[L1] D[0x0] M[300x250] OOP[F] ADUNIT[] T[]
Standard deviation is a statistical measurement that sheds light on historical volatility.
For example, a volatile commodity will have a high standard deviation while the deviation of a more stable commodity will be lower.
The reason we bring this up is that it has become apparent that with increased domestic and global grain and oilseed stocks, futures price volatility has dropped quite significantly over the past number of years.
That and rather benign growing weather over the past two years has resulted in few if any limit up or limit down days that were so commonplace a few years ago.
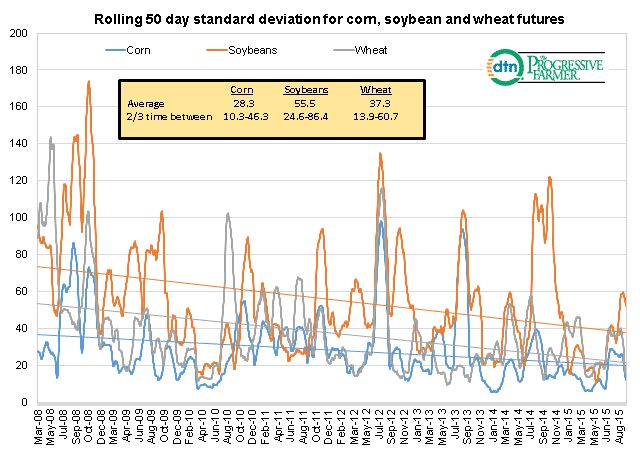
This graphic shows the 50 day rolling standard deviation of spot corn, soybean and wheat futures from March 2008 to the present.
A few things stand out including the trend toward lower standard deviations or lower volatility over the past seven years.
There also appears to be a pattern of seasonality with standard deviations tending to peak in the late spring-early summer, the most volatile time period for grain and oilseeds most likely due to the importance of weather this time of year.
Within the graph is a box showing the average standard deviation over the Mar 2008-Sep 2015 study period and the range in the standard deviations for each market that tend to prevail two-thirds of the time.
One trading guide is that volatility is imbedded within an option's value so when volatility of standard deviations are higher this inflates premium values while conversely periods of low standard deviation tend to depress premium values all else being equal.
For traders buying options when the standard deviation of corn is 10.3 or lower, soybeans at 24.6 or lower and wheat at 13.9 or lower makes sense, while option sellers should look to target sales when the standard deviation for corn is 46.3 or higher, 86.4 or higher for soybeans and 60.7 or higher for wheat.
(KA)
© Copyright 2015 DTN/The Progressive Farmer. All rights reserved.


Comments
To comment, please Log In or Join our Community .