

Fundamentally Speaking
Farmer Sales of Wheat, Price Changes
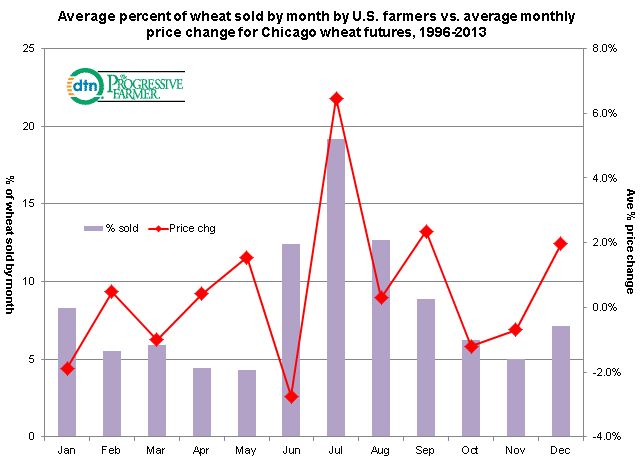
Concluding our look at how farmer marketing's of certain crops by month match up with the average monthly futures price change, we look at all wheat farmer sales by month vs. the average monthly percent price change for Chicago wheat futures utilizing data from 1996 to 2013.
Fortuitous for farmers is the fact that the month they market their highest percent of their crop at 19.2% prices posted their highest gains of the year, on average up 6.5%.
The other two highest marketing months of June at 12.5% and August at 12.7% show price changes of down 2.7% and up 0.3% respectively.
With over 45% of the year's crop marketed in these three months, farmer sales are spread out over the other eight months with a slight pop in January, consistent with corn and soybeans.
(KA)
P[L1] D[0x0] M[300x250] OOP[F] ADUNIT[] T[]

Comments
To comment, please Log In or Join our Community .