
Fundamentally Speaking
Mid-July Corn Conditions
We have been picking up comments about the ragged and inconsistent condition for a large part of the Iowa corn crop.
Much of this is due to the record amounts of rain that fell this spring resulting in many fields in the northeast and north-central sections of the state not even being planted.
For the crop that did get in the ground, the impact of the heavy rains in the north along with growing dryness in the south results in that state having far worse mid-July crop ratings than their neighbors to the east and west being Illinois and Nebraska.
Using our usual ranking system where we weight the crop based on the percent in each category and assign that category a factor of 2 for VP, 4 for P, 6 for F, 8 for G, and 10 for EX and sum the results the July 14 Iowa crop rating was 704 vs. 762 for Illinois and 758 for Nebraska.
P[L1] D[0x0] M[300x250] OOP[F] ADUNIT[] T[]
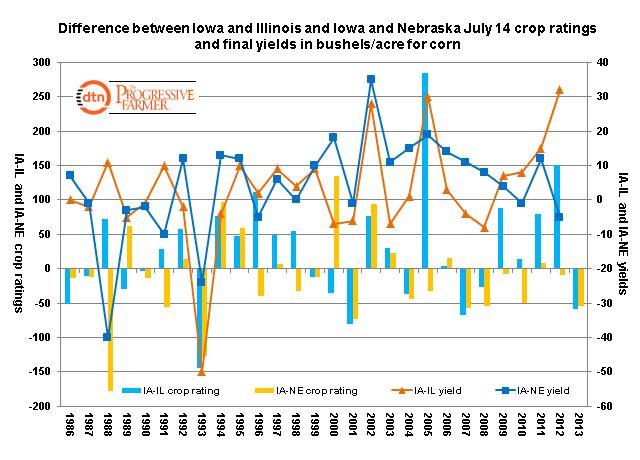
This graphic tracks the difference between IA and IL, and IA and NE July 14 crop ratings from 1986 to 2013.
These figures are compared to the final yield difference between IA and IL and IA and NE in bushels per acre (bpa).
On July 14 this year the IA corn crop was rated 58 points worse than the IL crop, the largest negative difference since 7/14/ 2007 when it was 68 points worse while that date in 2001 saw IA 80 points worse than in IL with 1993 providing the largest differential at 144 points.
Conversely, last year on July 14 the IA crop was 151 points better than IL and that was only topped in 2005 when it was 285 points better.
This July 14, the IA crop was 54 points worse than the NE crop and similar to Illinois the only other years the IA corn crop was rated that much lower than the NE crop on July 14 was in 2007, 2001, and 1993 though the biggest differential was in 1988.
How do the crop rating disparities impact yield differentials?
In 1993, final IA corn yields were 50 bpa below IL yields, 2001 they were six below, and in 2007, they were 4 below.
Note that IA corn yields have average three bpa above IL yields since 1986. For Nebraska, corn yields were 11 bpa lower than IA, in 2001 they were higher, 1993 they were 24 higher, and in 1988 they were 40 better when on average IA corn yields are 4 bpa better than those in NE.
If Iowa crop conditions continue to lag those of their westerly and easterly neighbors than this state that usually have the highest yields in the country should see lower yields than either Illinois or Nebraska.
(KA)
© Copyright 2013 DTN/The Progressive Farmer. All rights reserved.

Comments
To comment, please Log In or Join our Community .