

Canada Markets
December Spring Wheat Technical Signals
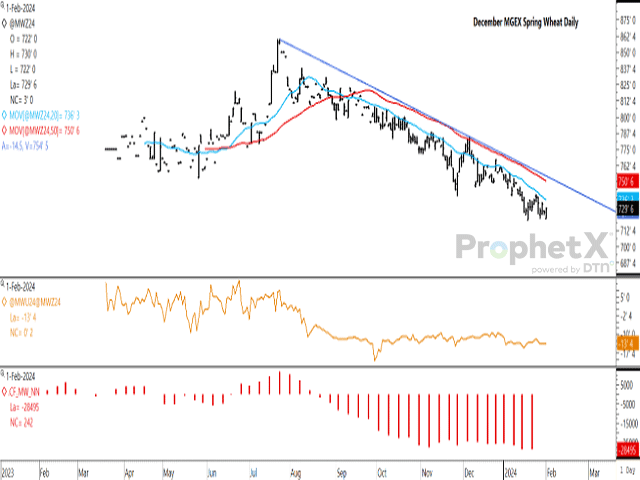
The December MGEX contract closed 3 cents higher this session at $7.29 3/4 per bushel (bu) after bouncing from this week's low of $7.22/bu. While not shown, it is taking little volume to move this market higher as the daily volume of 17 contracts Thursday fell for a fifth consecutive session to the lowest volume reported in 14 sessions.
Trade is holding above the Jan. 19 contract low of $7.21/bu. Potential support, given a breach of this low, may be found as psychological support of $7/bu. The continuous December contract spring wheat chart shows longer-term support of $6.82 1/2 bu, a level reached on Nov. 27 (December 2023 contract), as well as on May 24, 2021 (December 2021 contract).
P[L1] D[0x0] M[300x250] OOP[F] ADUNIT[] T[]
Price continues to hold below the contract's 20-day moving average at $7.36 1/4 bu, the 50-day at $7.50 3/4 bu and trendline resistance at $7.54 1/2 bu.
The brown line on the first study shows the September/December contract spread which strengthened 1/4 cent to close at minus 13 1/2 cents. It has traded mostly sideways over January. One year ago, this spread closed at minus 5 cents. The five-year average for Feb. 1 is also minus 5 cents. This is the weakest spread seen on this date since 2016 when the spread was reported at minus 15 cents.
The red histogram bars on the second study show noncommercial traders paring their bearish net-short position in spring wheat futures modestly over the week ending Jan. 23 to 28,495 contracts net-short, down from the record bearish futures position in the previous week.
While not shown, stochastic momentum indicators on the daily chart are seen drifting sideways and in the lower one-half of the neutral zone on the chart. The weekly chart shows these indicators also drifting sideways while in over-sold territory, which may act to slow further selling.
Cliff Jamieson can be reached at cliff.jamieson@dtn.com.
Follow him on X, formerly known as Twitter, @CliffJamieson.
(c) Copyright 2024 DTN, LLC. All rights reserved.

Comments
To comment, please Log In or Join our Community .