Canada Markets
Soybean Oil Futures Slide
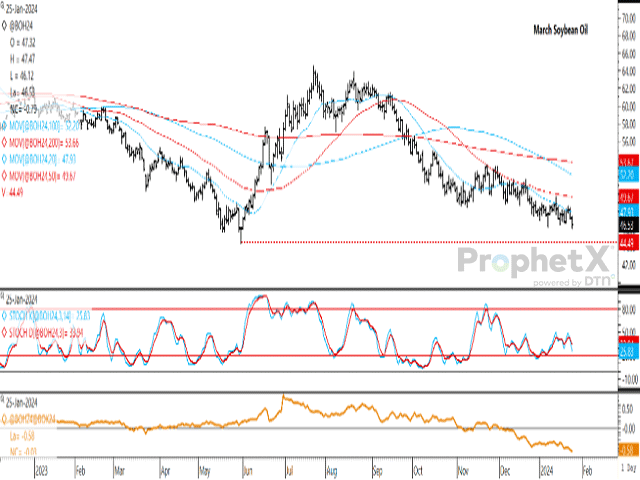
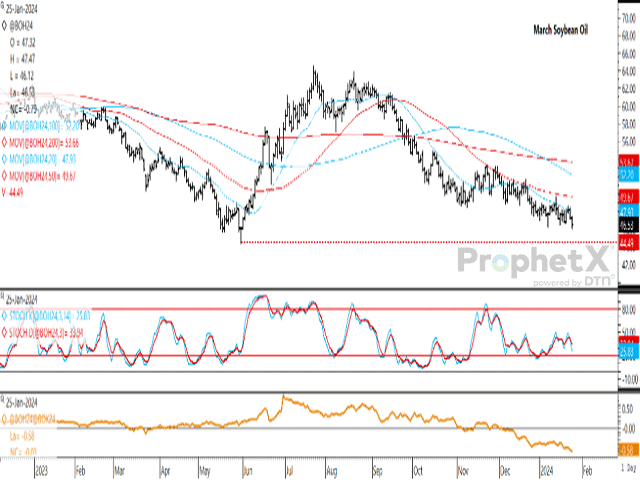
March soybean oil closed 0.79 cents lower at 46.53 cents/lb. USD, taking out its previous January low to reach the contract's weakest trade in almost eight months at a low of 46.12 cents. This move follows a failed attempt to sustain a move above the contract's 20-day moving average earlier in the week. This marks a second consecutive daily loss, with the contract poised for a second consecutive weekly loss.
Today's low marks the lowest trade since May 31, 2023 when a contract low of 44.49 cents was reached, which happens to be the next possible test of support should this price continue to drift lower. The continuous active chart shows a low of 44.53 cents for the same day, while a move below either of these levels leaves little chart support showing and could result in a continued slide.
P[L1] D[0x0] M[300x250] OOP[F] ADUNIT[] T[]
The stochastic momentum indicators on the first study that signal soybean oil's struggle in gaining and sustaining momentum, with indicators rolling over near the middle of the neutral zone on three occasions since early December, with the latest change of direction seen earlier this week.
The lower study shows the March/May contract spread trading as a bullish inverse as recent as Dec. 4, while weakening today to minus 0.58 cents, signaling a growing bearish sentiment overall.
In addition to bearish price action for soybean oil, both soybeans and soymeal futures printed bearish outside bars on their respective daily charts on Thursday, which adds to the bearish nature of the entire complex.
Cliff Jamieson can be reached at cliff.jamieson@dtn.com.
Follow him on X, formerly known as Twitter, @CliffJamieson.
(c) Copyright 2024 DTN, LLC. All rights reserved.


Comments
To comment, please Log In or Join our Community .