Canada Markets
Canola Price Trend vs. Global, Domestic Stocks/Use Ratios
USDA's Oilseeds: World Markets and Trade report for October saw few changes for global canola; it is unlikely this analysis draws the attention seen in the larger crops.
Production estimates included a 400,000-metric-ton (mt) lower revision for Canada to 17.8 million metric tons (mmt), which remains 400,000 mt higher than Statistics Canada's official estimate. It is interesting to note the production estimate for the "Other" category was changed little, despite a recent official estimate from Ukraine's Ag Ministry estimating production 300,000-mt lower than USDA, while there is continued concern over Australia's potential following the driest September on record. USDA lowered their global production estimate by 144,000 mt this month.
P[L1] D[0x0] M[300x250] OOP[F] ADUNIT[] T[]
Consumption of global canola/rapeseed was revised 340,000 mt lower to 85.247 mmt, which is only 6,000 mt higher than their forecast for the previous crop year. After importing a record 5.1 mmt in 2022-23, USDA continues to estimate China's imports to fall sharply to just 3.4 mmt over the 2023-24 crop year, which bears watching.
Global ending stocks of canola were revised slightly higher to 6.226 mmt, or 7.3% of use, down 1.361 mmt or 17.9% from the previous crop year. This remains higher than the 5.3-mmt ending stocks estimate released by the International Grains Council in September.
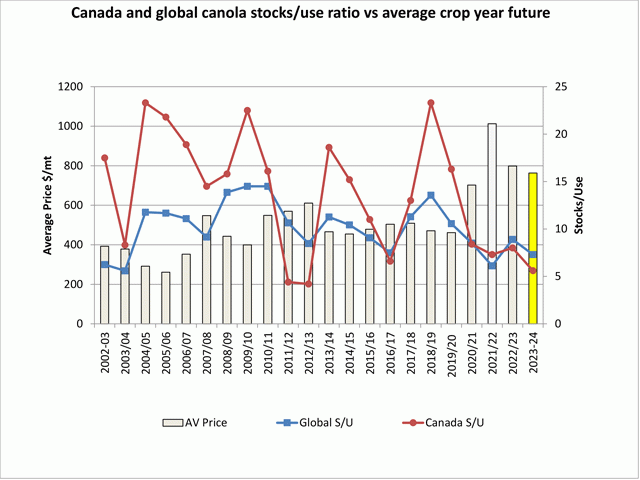
The attached graphic shows the trend in both the global stocks/use (blue line) and Canada's stocks/use (red line), along with the average futures price calculated for each crop year, based on the movement of the continuous active daily futures price.
The current stocks/use estimate for Canada of 5.6% for 2023-24, based on AAFC's September estimate, is the lowest seen since 2012-13 or 11 years. At the same time, USDA's current global stocks/use of 7.3% remains above the 6.1% calculated for 2021-22, an outcome that drove the average futures price to a high of $1,012.61/mt.
Cliff Jamieson can be reached at cliff.jamieson@dtn.com
Follow him on X, formerly known as Twitter, @Cliff Jamieson
(c) Copyright 2023 DTN, LLC. All rights reserved.


Comments
To comment, please Log In or Join our Community .