

Canada Markets
Statistics Canada's Production Estimates from September Forward

On Sept. 14, Statistics Canada released its second model-based crop production estimates based on August model data. Next up is a Dec. 4 release of production estimates, which is the first estimate for the season based on producer surveys.
For the Dec. 2, 2022, report, 27,200 producers were contacted from Oct. 7 through Nov. 14 and questioned on seeded acres, harvested acres, yields and production. The December release for any given year includes all provinces, with the earlier reports indicating that the reports include the largest producing provinces only, which excludes 2% to 4% of national production.
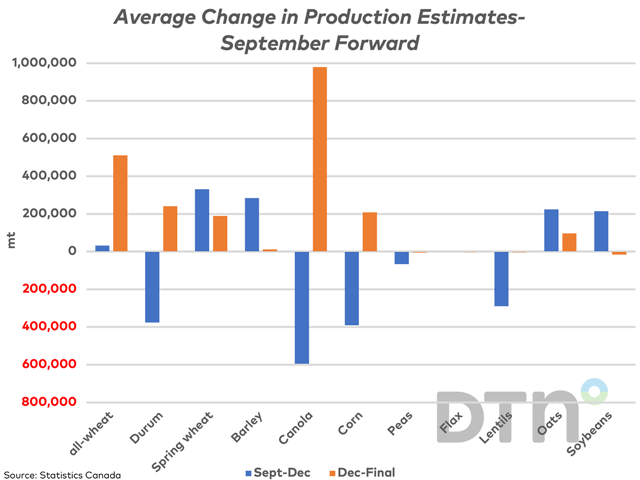
The blue bars on the chart represent the change in volume reported for select crops from the mid-September release (August model data) to the early December release based on producer surveys.
P[L1] D[0x0] M[300x250] OOP[F] ADUNIT[] T[]
It is interesting to note that on average, the size of the spring wheat crop was increased by 331,000 metric tons (mt), while the size of the durum crop was reduced by an average of 376,000 mt. This is consistent with what we have seen from the August-September reports this fall (July model data to August model data), with the spring wheat crop growing larger and the durum crop showing a lower potential. As seen on the chart, the all-wheat estimate has changed very little on average over the past three years, or by a modest 32,000 mt in the December report.
It is also interesting that the canola production estimate tends to be revised lower in December, calculated at a lower revision of 595,000 mt on average over three years. Like durum, this also represents a second consecutive lower revision, following a modest 193,433 mt decrease for canola in the Sept. 14 report. As the chart shows, the revision for canola on average over the past three years is the largest lower revision across select crops.
When the December report is released, Statistics Canada indicates that estimates are subject to revisions for a two-year period. As a result, some revisions have already been made and current table estimates may be higher or lower than the December estimates released for any given year. The three-year average revisions are shown by the brown bars on the chart.
The chart also indicates the government has found more spring wheat and durum over the past three years, adding 511,767 mt to the all-wheat estimate on average. The spring wheat estimate tends to rise by an additional 331,000 mt with durum 241,763 mt higher on average.
The largest change overall over the three-year period is an average upward revision of 979,567 mt of canola beyond the December estimates within the two following years. This may prove a bearish factor in the market if there's an expectation that the crop will always get larger on paper.
When one considers the change from the September production estimates released to the current table values, data for the last three years shows the most consistency for lentils, oats and soybeans. The lentil crop has grown smaller over each of the past three years by an average volume of roughly 294,000 mt. Over the same time, the oat crop has grown larger by an average of roughly 322,000 mt and the soybean crop by an average of 200,000 mt.
Cliff Jamieson can be reached at cliff.jamieson@dtn.com
Follow him on X, formerly known as Twitter, @Cliff Jamieson
(c) Copyright 2023 DTN, LLC. All rights reserved.
Comments
To comment, please Log In or Join our Community .