

Canada Markets
Statistics Canada releases July Trade Data

Statistics Canada's international merchandise trade for July reports total merchandise imports falling by 5.4% in July and exports rising by 0.7%. The report points to the West Coast port strike which slowed or stalled imports and exports during the month. As a result, Canada's trade deficit with the world narrowed from $4.9 billion to just $987 million, or the smallest deficit seen in three months.
The broad farm, fishing and intermediate food product category shows exports of $4.622 billion, the largest monthly exports seen in three months.
The following is a summary of select trade data for crops and products, focusing on crops other than the largest crops where weekly CGC statistics cover most of the export activity.
July lentil exports totaled 120,545 metric tons (mt), up slightly from the previous month and the smallest July exports in six years. When measured in value, two-thirds of exports were destined for India. Total exports are seen at 2.198 million metric tons (mmt), up 37.3% from the previous year and 6.1% higher than the five-year average. Total exports for the crop year reached 97.7% of Agriculture and Agri-Food Canada's (AAFC) forecast exports.
Dry pea exports totaled 167,680 mt in July, the largest volume shipped in three months and the largest July shipments in three years. Measured in dollar value shipped, 65% was shipped to China. Total exports over 12 months are shown at 2.562 mmt, up 34.1% from 2021-22 and 18% below the five-year average. Cumulative exports reached 96.7% of AAFC's 2.650 mmt forecast, which was revised to 50,000 mt lower in August.
Canada's chickpea exports are seen at 12,140 mt, the lowest volume shipped in 10 months. The largest share of the value shipped was destined for the United States, with 25% of the value shipped to the South. Total exports are shown at 224,395 mt, with exports up 27.4% more than one year ago and 60.5% higher than the five-year average. Exports achieved 96% of AAFC's forecast volume.
P[L1] D[0x0] M[300x250] OOP[F] ADUNIT[] T[]
Canary seed exports totaled 7,334 mt in July due to tight supplies. It was the smallest monthly volume shipped in over 10 years. Measured in value of shipments, the largest destination was Mexico with 33.6% of the value shipped. Cumulative shipments are shown at 145,707 mt, up 5% from one year ago and 4.4% below the five-year average. Total exports for the crop year are 0.5% higher than the AAFC volume.
Mustard exports plunged to 5,857 mt during July with the smallest volume shipped in 11 months. The largest share of the value shipped was destined for the U.S., with two-thirds of the dollar value of all shipments. Cumulative exports are up 25.4% from 2021-22 and 18% above the five-year average at 132,351 mt, while 10.3% above AAFC's forecast volume. It is interesting to note that AAFC revised this forecast lower by 15,000 mt in August.
Canada's flax exports rose for a second month to 26,351 mt and the largest monthly volume shipped in 19 months. A reported 56% of the value of exports was shipped to the U.S., while 33% was shipped to China. Cumulate shipments of 215,050 mt are down 1.9% from the previous crop year while down 47.7% from the five-year average. For some reason, AAFC has held its forecast steady at 150,000 mt.
Soybean exports fell for a second month on tighter supplies with 77,393 mt shipped in July, the smallest monthly volume shipped in the crop year's 11 months. Cumulative exports totaled 4.089 mmt over 11 months, down 1% from the previous year and 5.9% below the five-year average, while 8.2% below the most recent forecast of 4.5 mmt.
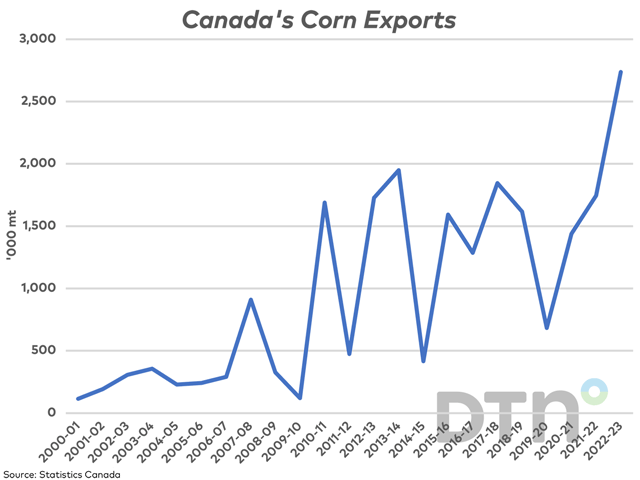
Canada's July corn exports are reported at 296,567 mt, falling for a second month to the lowest level seen in four months. When measured in value, 46% was shipped to the U.S. The balance was shipped almost entirely to European countries. Cumulative exports have reached 2.736 mmt over 11 months, 51.9% higher than reported one year ago and 93.4% higher than the five-year average. In August, AAFC increased its export forecast from 2.250 mmt to 2.7 mmt. The forecast has already been surpassed with another month of shipping data pending.
Statistics Canada reports corn imports at 234,270 mt, the largest volume reported in four months. Cumulative imports are seen at 1.803 mmt over 11 months, which is curiously lower than the current AAFC forecast of 2.6 mmt, which was revised to 250,000 mt higher in August.
Canola oil exports in July reached 272,182 mt, the largest volume shipped in four months. Cumulative exports total 3.152 mmt, up 22.6% from 2021-22 and .7% higher than the three-year average.
Canola meal exports totaled 482,453 mt in July, the largest volume shipped in four months. Meal exports totaled 5.281 mmt in 2022-23, up 20.2% from the previous year and 8.9% higher than the three-year average.
Canada's ethanol imports reached 287 million liters in July, the largest monthly volume imported for any month. So far in 2023, 1.51 billion litres have been imported, up 61.8% from the same period last year and 105.3% higher than the three-year average.
Biodiesel imports totaled 91,155 mt in July, the smallest volume imported in four months and well below the 132,093 mt record volume imported in April. Over the first seven months, imports totaled 507,408 mt, up 89% from the same period in 2022 and 55.6% higher than the three-year average.
Cliff Jamieson can be reached at cliff.jamieson@dtn.com
Follow him on X, formerly known as Twitter, @Cliff Jamieson
(c) Copyright 2023 DTN, LLC. All rights reserved.
Comments
To comment, please Log In or Join our Community .