

Canada Markets
Prospective 2023-24 Canadian Wheat Ending Stocks Matrix
This week's Statistics Canada seeded acre estimates included a forecast for Canada's all-wheat and spring wheat acres to be the highest seen since 2001, while at the upper end of a number of pre-report estimates released.
The report has drawn criticism, with close to 20% fewer producers surveyed, while what has been historically referred to as the March intentions report has been shifted to a mid-December through mid-January survey, months in advance of spring seeding. Wheat acres were expected to rise prior to the report, although a clearer view of the decisions made may be found in the June 28 release of the Principal field crop areas report.
P[L1] D[0x0] M[300x250] OOP[F] ADUNIT[] T[]
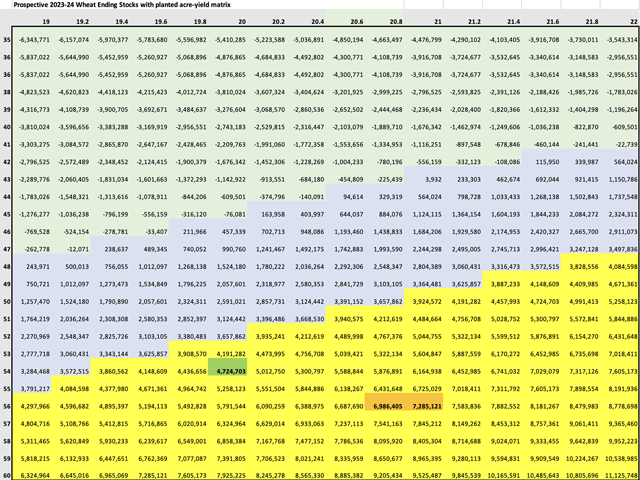
The attached chart shows potential ending stocks for 2023-24 wheat (excluding durum) as acres vary across the horizontal grid (in millions) and yield varies along the vertical axis, in bushels/acre. Assumptions made are based on the current Agriculture and Agri-Food Canada forecast for 2023-24, which includes beginning stocks of 3.8 million metric tons (mmt), harvested acres that represent 98% of acres seeded, 19.6 mmt of exports and 8.280 mmt of domestic demand.
The upper-green shaded area shows combinations of yield and acres that lead to negative stocks based on the current assumptions. The blue-shaded area in the middle of the chart represents combinations of yield and acres where stocks are calculated to fall from the current forecast of 3.8 mmt in 2022-23. The yellow-shaded area shows combinations of acres and yield that will result in higher ending stocks. As indicated, this is based on the current AAFC forecast that shows total demand of 27.880 mmt, while in reality, higher production and increased supplies could lead to higher exports. AAFC's export demand forecast for 2023-24 is 19.6 mmt, while the 2021-22 record for wheat exports (excluding durum) is 20.6 mmt, or 1 mmt higher.
The green-shaded box with stocks of 4.724 mmt (in bold) is close to the April AAFC forecast of 54 bushels per acre yield, based on historical averages, along with their April estimate of 20 million acres.
The brown shaded area with bold numbers represents the range of stocks (approximately 7 mmt to 7.3 mmt) should the 20-year trend yield of 55.5 bpa be realized along with Statistics Canada's estimated area of 20.9 million acres, based on this study's assumptions.
Cliff Jamieson can be reached at cliff.jamieson@dtn.com
Follow him on Twitter @Cliff Jamieson
(c) Copyright 2023 DTN, LLC. All rights reserved.

Comments
To comment, please Log In or Join our Community .