Canada Markets
Canadian Canola follows Australian Canola Lower
March 16 trade saw the ICE canola contract for May delivery close higher for the first time in 10 sessions, ending up $4.80/metric ton at $755.80/mt, while reaching its lowest level traded on the continuous active chart since. Today's move saw the May contract dip to its lowest level seen since June 2021 on the continuous active chart, while closing $18.60/mt above this session's low.
Over the 10 days, the May contract has fallen $69.50/mt, while has lost $62.40/mt so far this month.
P[L1] D[0x0] M[300x250] OOP[F] ADUNIT[] T[]
Prices are oversold on the daily chart and close to it on the weekly chart, while the speculative trade held a large short position of 70,660 contracts as of Feb. 28 and a net-short of 51,913 contracts, the largest net-short seen since June 2, 2020.
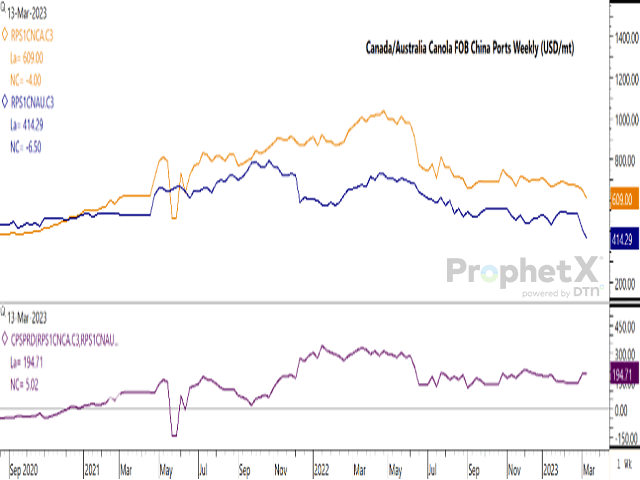
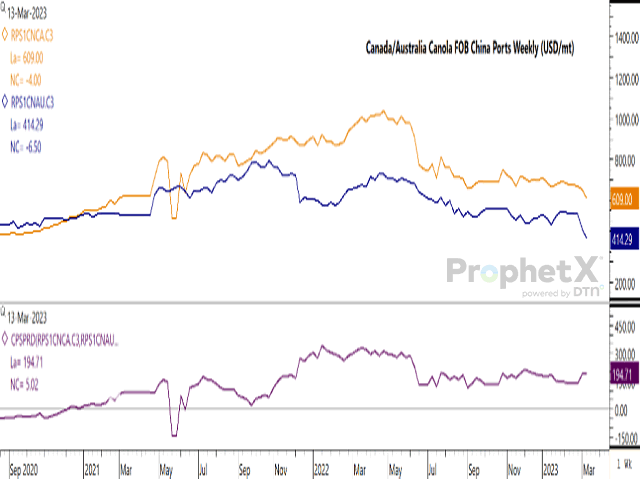
At the same time, the attached chart shows Canadian canola growing less competitive relative to Australian product FOB China's ports, according to ProphetX data. So far this month, Canadian canola has fallen $65.50/mt USD, to $609/mt USD, while Australian canola has fallen by $121.28/mt, to $414.29/mt USD. The spread has grown by $55.78/mt USD so far this month to $194.71/mt USD (Canadian product over Australian), the largest spread seen since July 2022 on the monthly chart.
Despite the favourable close on March, Canadian canola will continue to struggle in this market and may face further downside risk.
Cliff Jamieson can be reached at cliff.jamieson@dtn.com
Follow him on Twitter @Cliff Jamieson
(c) Copyright 2023 DTN, LLC. All rights reserved.


Comments
To comment, please Log In or Join our Community .