

Canada Markets
USDA Releases Bearish Canola Data
USDA released supportive soybean data on Wednesday which led to modest gains in both soybean and soybean oil futures, while Brazil's harvest of an expected record crop continues to cap upside potential.
Estimates released for global canola/rapeseed can be viewed as bearish. The March Oilseeds: World Markets and Trade shows the USDA revising higher their forecast for global rapeseed/canola production by 1.229 million metric tons since February to a record 86.305 mmt. This is up 12.280 mmt or 16.6% from 2021-22, while 13.130 mmt or 18% higher than the five-year average.
This month's increase in production is due entirely to an increase in the USDA's "other" category, which is consistent with the upward adjustment in forecast production reported by Australia's ABARES this week. Since the first forecast was released in May 2022, the global production forecast has been revised higher eight times, or from 80.320 mmt in May 2022 to the current 86.305 mmt.
P[L1] D[0x0] M[300x250] OOP[F] ADUNIT[] T[]
Over this period, the consumption forecast has also been revised higher, although by roughly 4 mmt as compared to the 6 mmt upward revision in production.
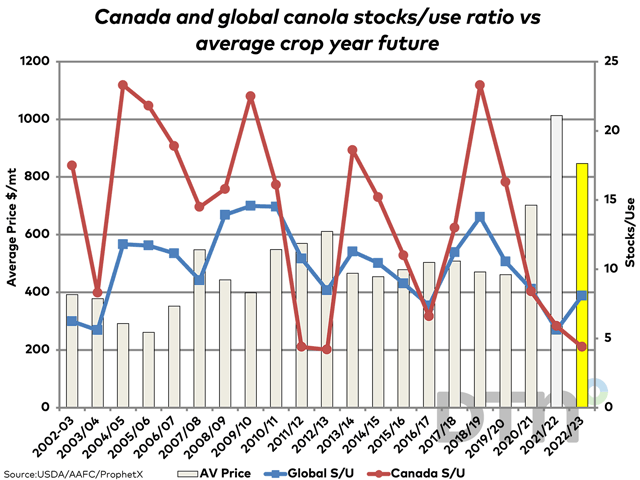
This month saw the USDA's forecast for 2022-23 global stocks up 509,000 mt from the February estimate to 6.672 mmt, which are up 2.461 mmt or 58.4% from 2021-22. This would be the highest stocks seen in three years.
As seen on the attached chart, AAFC's forecast for Canada's ending stocks/use (red line) is forecast to fall for a fourth consecutive year to 4.4% in 2022-23. This is seen diverging from the global estimate (blue line), which is forecast to rise for the first time in four years to 8.1%.
In 2020-21, the global stocks/use ratio of 8.6% is .5 percentage points higher than the global forecast for the current crop year, while the average daily continuous canola close for the crop year was $702.13/mt, which compares to the average so far this crop year of $846.65/mt (Aug. 1-March 8, yellow bar).
Cliff Jamieson can be reached at cliff.jamieson@dtn.com
Follow him on Twitter @Cliff Jamieson
(c) Copyright 2023 DTN, LLC. All rights reserved.

Comments
To comment, please Log In or Join our Community .